
AI systems can fail while every normal engineering signal looks fine. The app is online. Error logs are clean. Tests pass. No exception gets thrown. Yet the answer is wrong, the agent used the wrong tool, response quality has dropped, or the monthly model bill has suddenly tripled.
That is the awkward reality of software with a model in the loop. It does not always crash when it fails. It can carry on confidently and give a bad answer.
I use Langfuse to get proper visibility into what is actually happening. It records what the model received, what it produced, which tools it called, how long each step took, what each turn cost, and whether the result was any good. It is an open source, MIT licensed LLM observability platform. I can run it myself or use its hosted tier.
That trace data becomes especially useful with AI coding agents such as Claude Code, Pi, Codex, and Hermes Agent. It is also essential for custom AI apps that use tools, retrieval, sub-agents, and API-based model inference.
Why ordinary logs are not enough for AI applications
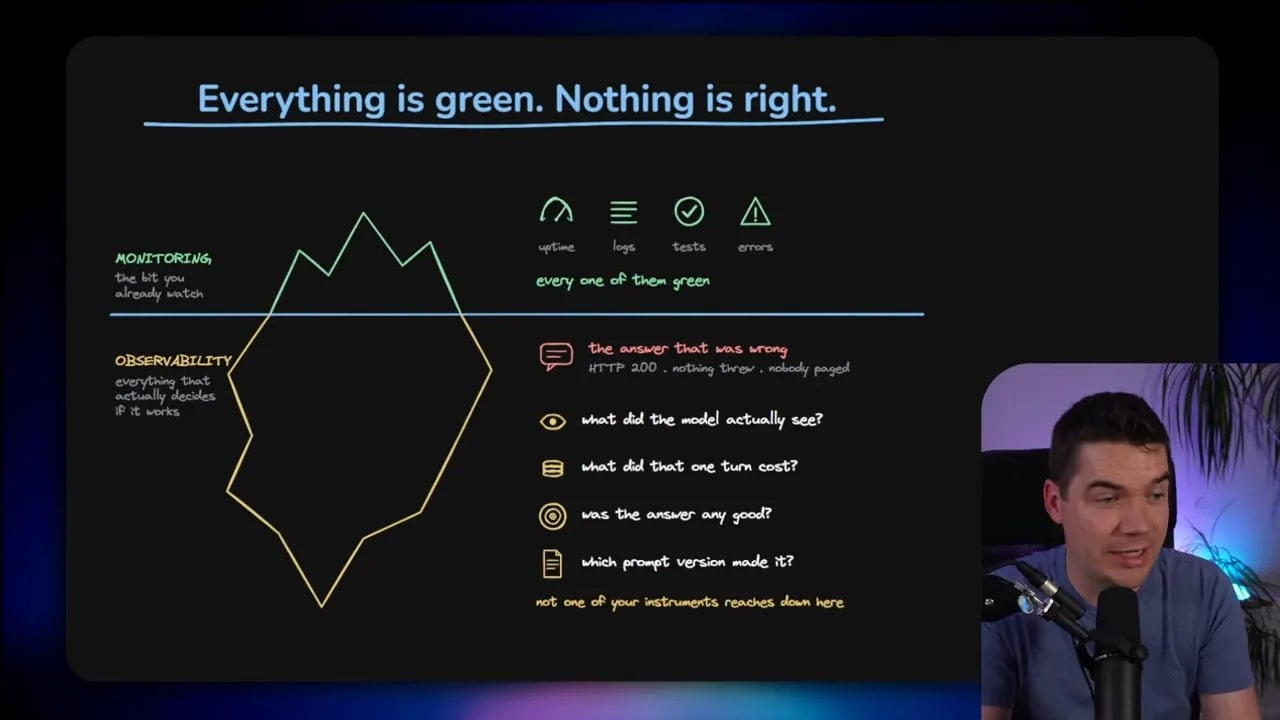
Traditional logging tells me whether a request completed, whether a database connection failed, or whether an endpoint returned a server error. Those are useful signals. They only show the surface of the system.
AI applications have a much larger hidden layer. A response can be technically successful while still failing the actual task. The agent may retrieve the wrong document. A RAG system may find nothing useful. A tool description may mislead the model. A prompt may contain contradictory instructions. A sub-agent may spend a large amount of tokens on unhelpful work.
This is why I think about AI observability as X-ray vision. I need to know:
- What instructions did the model receive?
- What was the full system prompt at that point in time?
- Which tool definitions were available?
- What did the agent pass to each tool?
- What came back from the tool?
- What did the model do next?
- How many input, output, and cached tokens did the request use?
- What did that turn cost?
- Did the answer meet the quality standard?
- Which prompt version and software release produced the result?
Without that information, I am often asking an AI coding agent to inspect a problem that I cannot describe fully. Coding agents tend to go where I point them. They do not reliably surface issues that I did not ask them to investigate. A trace gives both me and the agent evidence from the specific failed run.
What Langfuse captures
Langfuse organizes activity in a practical hierarchy. A session usually represents a conversation or a wider user task. A session can contain several traces, which often map to individual turns. Each trace contains observations, such as LLM generations, tool calls, retrieval steps, embeddings, and nested sub-agent work.
That nesting matters. An agentic workflow is rarely one model call followed by one answer. A user question can trigger a chat completion, a document search, a vector embedding, a keyword search, a reranking step, a document-analysis sub-agent, and one or more final model calls. If I only see the final response, I cannot tell where the workflow went wrong.
With a full trace, I can expand each layer. I can see the input and output of a generation, the arguments passed to a tool, the tool result that flowed into the next step, latency, and token usage. In a custom application, I can instrument this in enough detail to see the system prompt and tool definitions as well.
For production systems, I also tag traces with information that makes later investigation possible:
- User ID: an internal non-identifying ID, so I can inspect cost and behavior by user without storing personal details.
- Environment: for example, development or production.
- Release ID: the application version that handled the request.
- Trace tags: labels that make a busy trace list searchable and filterable.
Once these fields are present, it becomes much easier to identify whether a cost increase appeared after a release, whether a certain user workflow is failing, or whether a new prompt version has reduced answer quality.
Pi Agent: seeing exactly where token use comes from
Pi is a lean coding agent, but extensions can change its token footprint very quickly. I ran a new Pi session and asked it to create a research dossier on Langfuse. That setup had both web search and sub-agent extensions installed.
The task spun up three research sub-agents and then a review sub-agent. Langfuse showed five traces across two sessions. The total work represented more than $5 of API usage, even though I was using a Codex subscription and was not paying that API bill directly. The point is clear: sub-agents can consume a serious number of tokens.
One trace showed the initial user request, then every tool call and model turn that followed. The output of one action becomes input to the next. For coding agents that can run dozens of tool calls, this record is invaluable.
The bigger finding was in the system prompt. A plain Pi installation with the four native tools had an initial prompt of roughly 1,300 tokens. In another run, it was about 1,000 tokens. After adding web search and sub-agents, the initial prompt reached about 7,900 tokens.
The extensions had expanded the available tools from four to twelve. Each tool needs a definition that tells the model what it can do and how to call it. Those definitions are text. They consume context on every turn.
This is how a single Pi task reached roughly 3.5 million tokens. A model may need to receive the same lengthy instructions and tool descriptions repeatedly throughout a multi-step agent loop. The task itself can look harmless, yet the repeated context creates substantial usage.
Tracing lets me see that bloat rather than guessing. I can inspect the full system prompt, determine which tool definitions take the most space, and decide whether an extension is worth its ongoing token cost.
Hermes Agent: a simple greeting can carry a huge prompt
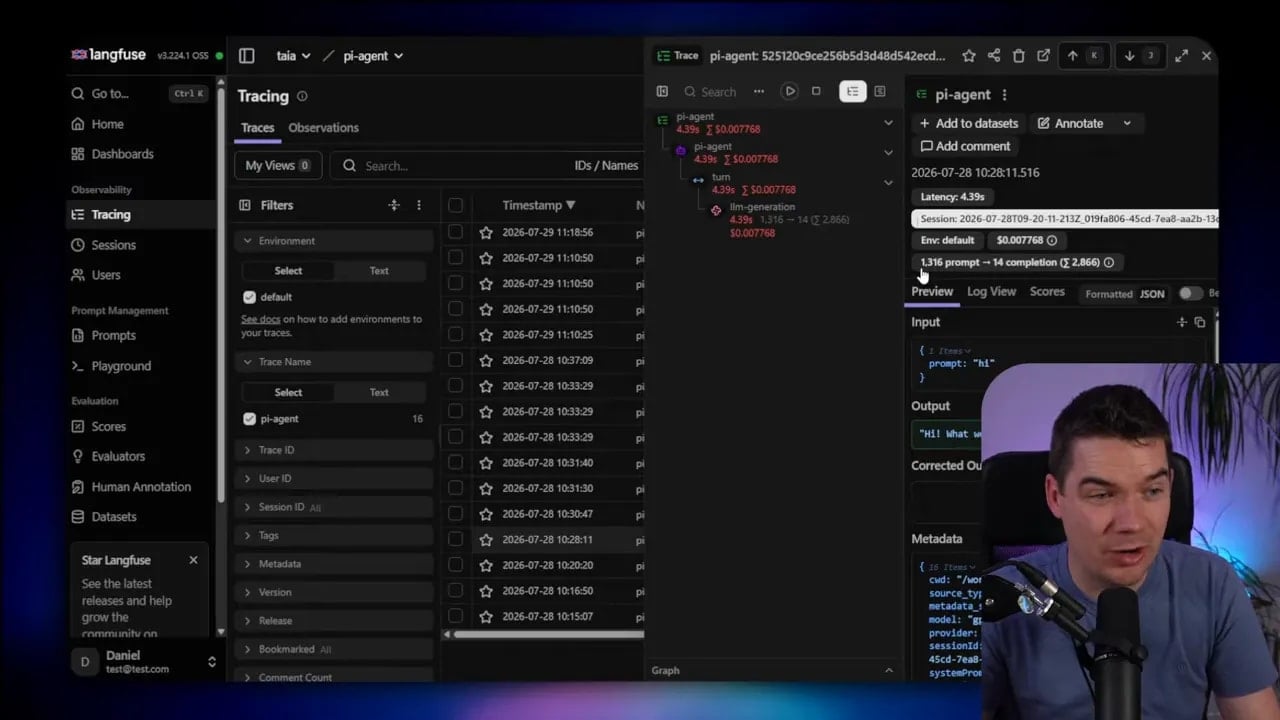
Hermes Agent makes the system prompt issue even more obvious. I started a new session and entered a simple greeting. The response used around 31,000 tokens.
The reason was not the greeting. Hermes had 31 tools available. The underlying system prompt and tool definitions were extensive, even in a fairly standard installation without a large set of extra tools.
I used the cloud version of Langfuse in this case because Hermes was running on a VPS. After opening the session trace, I could see the complete prompt, all 31,000 tokens of it. It simply continued for a long time.
I did make patches to the Hermes Langfuse plugin so it would surface the full system prompt and tool definitions. Hermes is open source, so that level of integration is possible. The patch details are available in the Hermes Langfuse setup instructions.
The lesson is broader than Hermes. Extra tools do not come for free. They increase the agent’s capability, but each one can increase the instructions the model must process. A trace helps me balance capability against context size, cost, and model confusion.
Claude Code gives useful visibility, but not the whole picture
I also installed the Langfuse plugin in Claude Code. It uses Claude Code hooks, so it can record conversational turns, the prompt I entered, the assistant output, tool calls, tool inputs, tool outputs, and transaction token counts.
That is useful visibility. It is not the same as total visibility.
Claude Code is a closed application. The integration does not expose its hidden system prompt or tool definitions. I can see that a simple greeting may use around 57,000 tokens, but I cannot inspect what makes up those tokens without taking more invasive measures such as setting up a proxy to reverse engineer the flow.
Claude Code itself can have a system prompt in the 20,000 to 30,000 token range alongside tool definitions. Langfuse still gives a good record of what happened during the agent workflow. It just cannot reveal everything that a closed tool keeps hidden.
That distinction matters. I should not assume every Langfuse integration can provide identical detail. Pi can expose everything. Hermes can expose everything with the appropriate plugin changes. Claude Code gives a meaningful but partial record.
The available integrations are documented for Claude Code, Pi Agent, and Hermes Agent.
Custom AI apps are where tracing becomes essential
Tracing becomes even more important when I am building my own AI application. These systems can become complicated quickly. A custom app might combine chat, RAG, document uploads, vector search, hybrid search, reranking, citations, sandboxes, memory, sub-agents, and multiple models.
I need a dashboard that rolls up usage across all of that. Langfuse gives me totals for sessions, traces, observations, model usage, latency, and cost. I can also break spending down by user.
In one user session from my custom app, a trace showed all the details for an agentic RAG workflow. I could inspect the system instructions, tool definitions, inputs, outputs, and each tool call. More importantly, I could see which documents the retrieval tools actually returned.
That is a key point for any RAG application. An answer may sound convincing but be based on poor retrieval. If the app uses vector search or hybrid search, I need to inspect:
- The query passed to the search tool.
- Any metadata or folder filters.
- The embedded version of the query.
- The vector search result.
- The keyword search result.
- The reranking stage.
- The final documents and passages passed back to the model.
Langfuse also records latency for these steps. That gives me a practical route to performance improvements. I can see whether a slow answer came from the model, the embedding request, document search, reranking, or a nested sub-agent.
What a good trace looks like
I use sessions to group related conversational turns. Then I open an individual turn to inspect it in depth. A good trace has enough context to recreate the logic of the run without forcing me to sift through vague application logs.
For example, I asked my app about a legal brief in the knowledge base. The app used several tools to find and analyze the document, then returned an answer with inline citations.
The trace showed the top-level chat handling step, an OpenAI generation, and three tool calls. One was a document search using hybrid retrieval. The trace showed that no folder IDs or metadata filters were supplied, along with the exact search query.
From there, I could see the query being embedded, the vector data coming back, the keyword search, and the reranking work. Those tool outputs fed into a later model generation, which then triggered a document-analysis sub-agent. The sub-agent appeared as a nested part of the same trace.
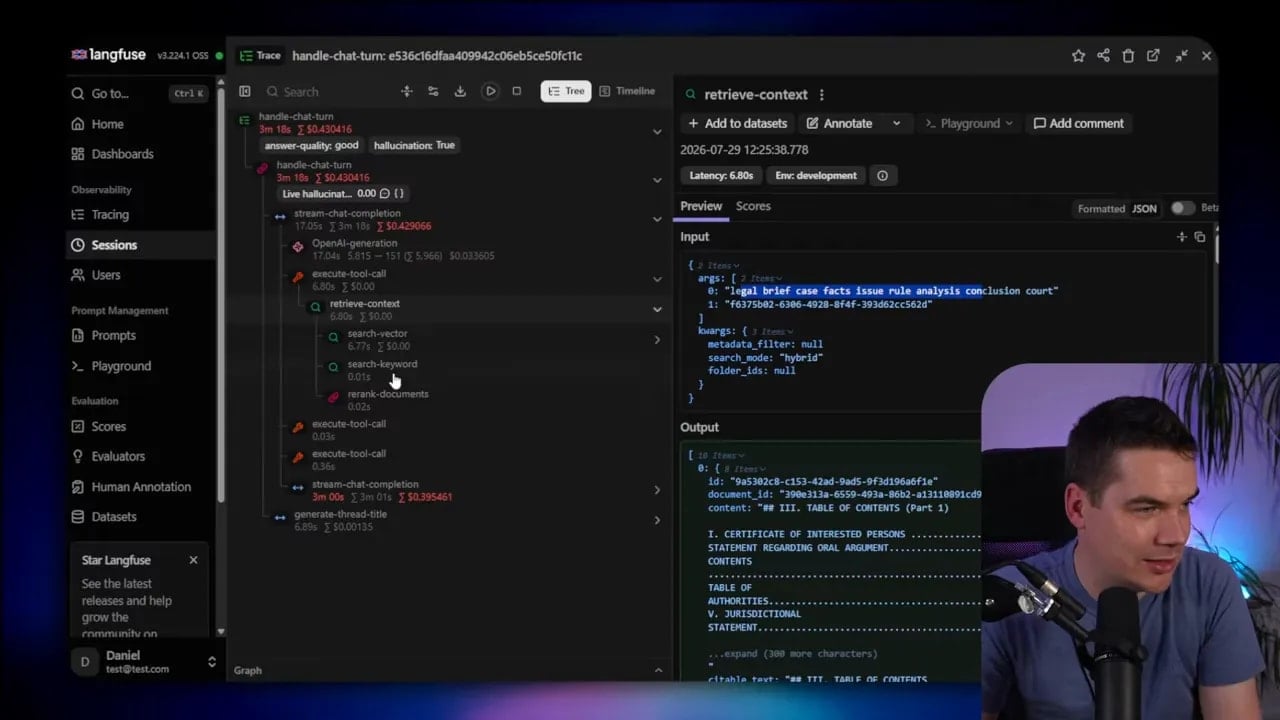
This call stack is what I need when debugging an agentic system. It lets me move from a session, to a trace, to individual observations, and down into every important step.
I also make traces manageable over time. Tags allow filtering in the tracing interface. Comments let me leave notes for later review or reporting. Annotations add structured labels, such as whether the answer quality was good or whether a hallucination occurred.
Finally, I can add a trace to a dataset. That takes a real production example and turns it into useful evaluation material. For a RAG answer dataset, I can store an input and expected output as ground truth for future testing.
Give the coding agent access to trace data
The trace does not have to sit in a dashboard waiting for manual review. Langfuse can also give an AI coding agent access to production traces through its agent skill or MCP server.
I asked Claude Code to fetch the latest Langfuse session trace. Using the installed skill, it pulled the complete details for that run. This is logging on a different level from asking a coding agent to add a few temporary print statements.
The coding agent can work with both sides of the problem. It has access to the codebase and access to the run that failed. If a tool call was malformed, retrieval was poor, or a sub-agent returned an unhelpful result, the agent has the evidence needed to investigate the relevant implementation.
This remains useful in production. I can inspect a specific customer trace rather than relying on a vague report that an answer was wrong. Langfuse provides an agent skills repository and an MCP server for this workflow.
Prompt management: change prompts without a full deployment
Prompts often begin as constants in the codebase. That is simple at first. It becomes awkward when every prompt adjustment requires a new application deployment.
Langfuse prompt management lets me move prompts out of the codebase. Each prompt has a name and version. One version carries the production label, which determines the version the application uses.
The app requests the prompt by name. It is cached locally, so this does not add latency to every request. If the platform is unavailable, the app can fall back to a constant stored in code.
Each trace then records the prompt version that created it. This is extremely useful because latency, cost, and evaluation scores can all be tied to a specific prompt version.
In my app, I organize prompts into folders for different areas of the system. The chat section has prompts for sandbox behavior and workspace sandbox functionality. Another prompt defines the document-analysis sub-agent.
I can create a new version, experiment with an instruction change, and inspect the traces linked to that version. The MCP server also means a coding agent can help iterate on prompt versions.
This matters because coding agents often append instructions when asked to modify a system prompt. If I ask for five changes over time, the result may become a long prompt with duplicated or conflicting rules. The model can then become confused, behavior deteriorates, and costs rise. Reviewing actual prompt content in traces is one of the fastest ways to spot the problem.
Scores, feedback, and evaluations answer the quality question
Tracing tells me what happened. It does not automatically tell me whether the response was good. That requires evaluation.
Langfuse supports scores in several forms. I can use a numerical score, a category, or a simple pass or fail. The score can come from four main sources:
- User feedback: a thumbs up or thumbs down in the application.
- Human review: QA reviewers, subject matter experts, or user acceptance testing.
- Deterministic code checks: objective checks that do not require another model.
- LLM as a judge: a model-based assessment for more subjective quality questions.
In my app, a user can mark an answer as helpful or unhelpful. A negative rating can also include a reason, such as the answer did not understand the question. Langfuse stores that feedback as a score against the specific trace.
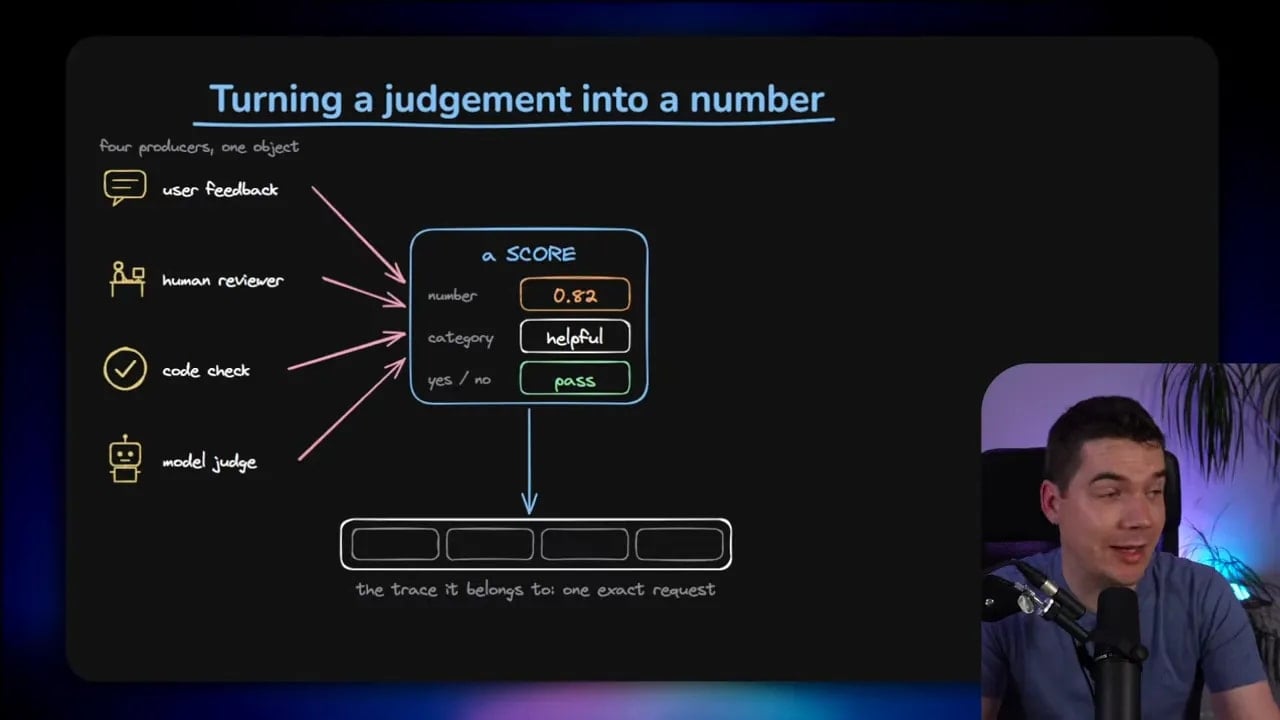
That link to the trace is important. I do not just get a detached complaint. I get the prompt, retrieved context, tool behavior, model output, version data, and the feedback in one place. The bad answer can go into a queue for human or AI-assisted review.
Once I fix the issue, I add the failed case to an evaluation dataset. This prevents regressions. A prompt change or tool-description change might fix one case while breaking another. Systematically rerunning the dataset against expected outputs gives me a safer way to improve the application.
I use deterministic checks wherever possible because they are cheaper than an LLM judge. For example, if every answer must include a citation, code can check whether a citation exists. If I need to determine whether an answer hallucinated or remained faithful to retrieved knowledge-base content, that is a more suitable job for an LLM judge.
Protect sensitive data before it reaches traces
Observability comes with a serious responsibility. A trace can become a second copy of everything that passed through the application. Redacting sensitive data from the model provider is not enough if the same information is still being recorded in a tracing platform.
In my own app, I use a redaction system to stop sensitive information from going to cloud services. When integrating Langfuse, I had to audit the traces carefully because redacted information that did not reach the model provider was still being logged.
That is exactly the kind of leak that can be missed if observability is treated as an afterthought. I need to mask what should be masked and verify that the trace does not contain it. User IDs should also avoid personally identifiable information wherever possible.
Before deploying tracing to production, I would audit representative traces and check every layer: model inputs, model outputs, tool arguments, tool responses, metadata, comments, and attachments. The goal is useful evidence without unnecessary exposure.
Self-hosting Langfuse or using the cloud
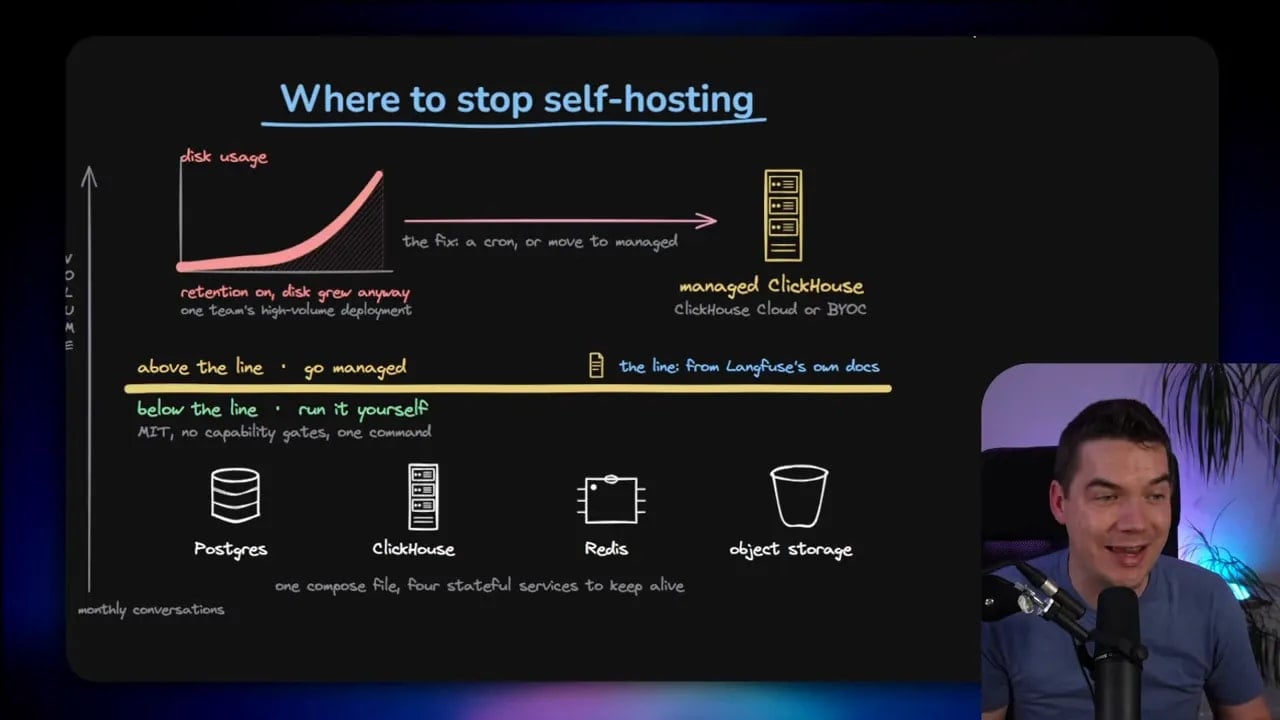
Langfuse is open source and free to self-host. I run it locally in a Docker stack. The stack includes Langfuse workers, the web interface, Postgres, ClickHouse, Redis, and MinIO. Docker Compose is the simplest route for running it on a local machine.
For production, the right hosting method depends on trace volume and depth. Langfuse provides self-hosting guidance for Docker, Railway, Kubernetes, AWS, and Azure in its self-hosting documentation.
The hosted Langfuse tier includes a free hobby allowance of 50,000 units per month. A unit does not only mean a trace. It relates to observations and evaluation scores as well. A rich agentic trace can include a large number of observations, so usage can grow quickly.
More detail has a cost. That does not mean I should avoid capturing useful data. It means I should instrument intentionally:
- Capture observations that help explain behavior.
- Avoid recording unnecessary low-value events.
- Sample traces if full capture is not needed for every request.
- Set spend alerts.
- Keep an eye on traces with deeply nested agent behavior.
I also looked at two alternatives. Arize Phoenix is lighter, but it is source available rather than open source and uses the Elastic License 2.0. LangSmith charges differently, with one trace equaling one unit and a free monthly trace allowance, but it is not open source.
Langfuse has the advantage of being MIT licensed, self-hostable, and feature-complete without capability gates. Cloud usage requires attention to units, while self-hosting shifts the responsibility to my own infrastructure.
Choose infrastructure based on production trace volume
For a lower-volume setup, self-hosting on a single machine can make sense. Langfuse runs with Postgres and Redis alongside the rest of its stack. It is practical for development, experiments, and smaller deployments.
At a larger production scale, I would be cautious about placing the entire observability system on one server. If I am tracking every request, every tool call, and every evaluation in a high-volume app, the tracing infrastructure must scale alongside the application itself.
That can mean Kubernetes, managed ClickHouse, or a bring-your-own-cloud approach. The purpose is not to make the deployment unnecessarily complicated. It is to avoid making the observability layer a point of failure while retaining the data required to understand production behavior.
Traditional logs often become sparse in production or only capture exceptions. AI observability works differently. Each user can produce a different model response on every turn. The system needs a record of that behavior in production, because that is where the unexpected failures, cost spikes, and quality drops actually appear.
