
I created an automation that can import tens of thousands of documents into an n8n RAG (Retrieval-Augmented Generation) system with a single click. I recorded this process for The AI Automators to show how to build an orchestrator workflow, run parallel ingestion jobs, and automatically recover from failures without manual intervention. This article breaks down the architecture, the key nodes, the database tracking model, and five crucial lessons I learned while pushing n8n to handle thousands of files per hour.
Overview
Most people set up a RAG pipeline that listens for new files, chunks the content, creates embeddings, and stores vectors in a database. That works great for a few documents. Things get difficult when you want to process thousands at once. Memory errors, database bloat, API rate limits, and fragile workflows can make a large import take days or weeks. I had to solve all these problems in order to reach 5,000 files per hour.
In short, my solution uses an orchestrator workflow that reads a file list, creates parent and child execution records in Supabase, calls the ingestion workflow via webhook for each file (one file, one execution), polls the child execution statuses, retries failures automatically, and advances through batches until the folder is fully processed. Breaking a large job into many small, tracked executions keeps n8n and external services stable.
The scaling challenge
When you scale from tens to thousands of files, several issues appear:
- Memory overload: Passing many binaries or large base64 strings into a single workflow can crash n8n.
- Database bloat: Saving execution data for every success can fill Postgres quickly.
- Provider rate limits: OpenAI, Supabase, or other APIs can throttle or block requests if you flood them.
- Infrastructure limits: Supabase compute and storage tiers can be exhausted.
- Edge-case failures: Rare errors start appearing only when thousands of executions run, and they can stop your whole import.
I spent over 100 hours building, testing, and tuning the solution so it could hit 5,000 documents per hour. The approach I followed focuses on small, trackable executions and multiple layers of error handling.
The overall approach
My orchestrator pattern does three main things:
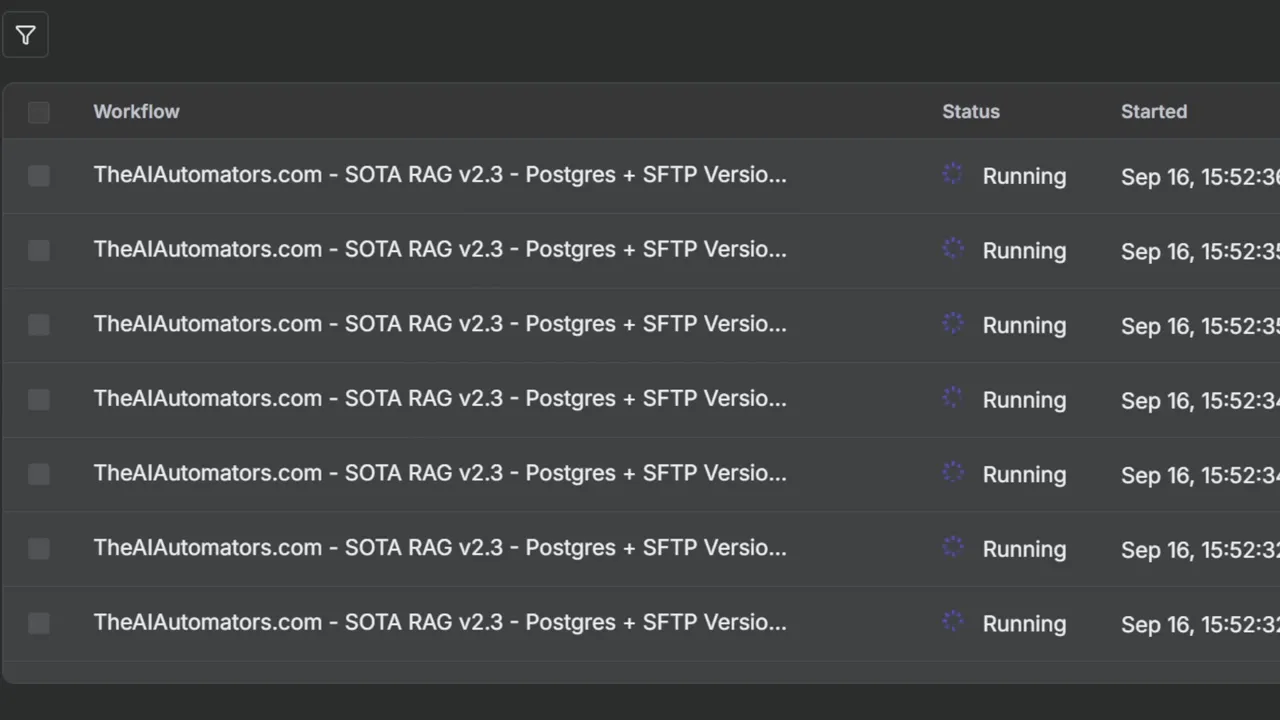
- It batches files into manageable groups and then issues many one-file executions in parallel.
- It tracks each execution with a parent/child record in a database table so it can monitor success or failure.
- It runs a separate error-handler workflow that updates the database when any execution fails, allowing automated retry logic in the orchestrator.
Using webhooks to invoke the ingestion workflow is a deliberate decision. Webhooks let the n8n instance delegate work to workers in queue mode, which makes the whole system far more stable and parallel. Webhooks also provide a response that includes the execution ID; that ID is essential to track each child execution.
Demo and high-level behavior
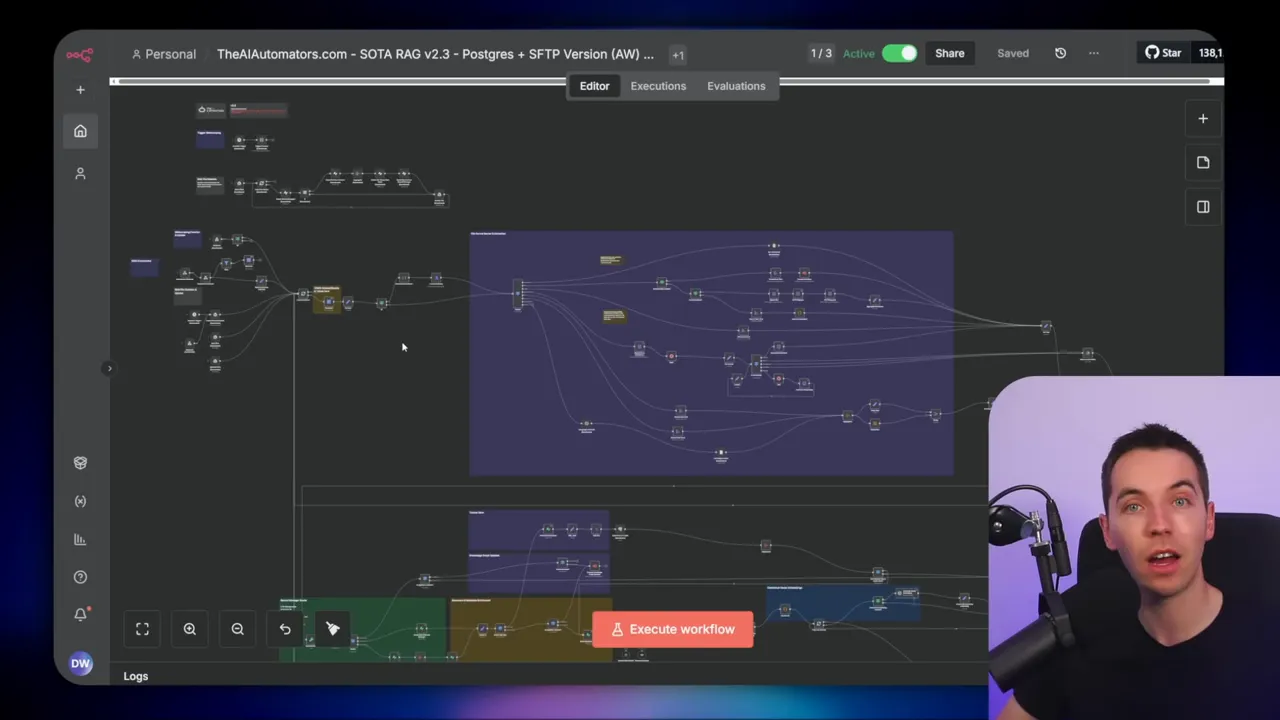
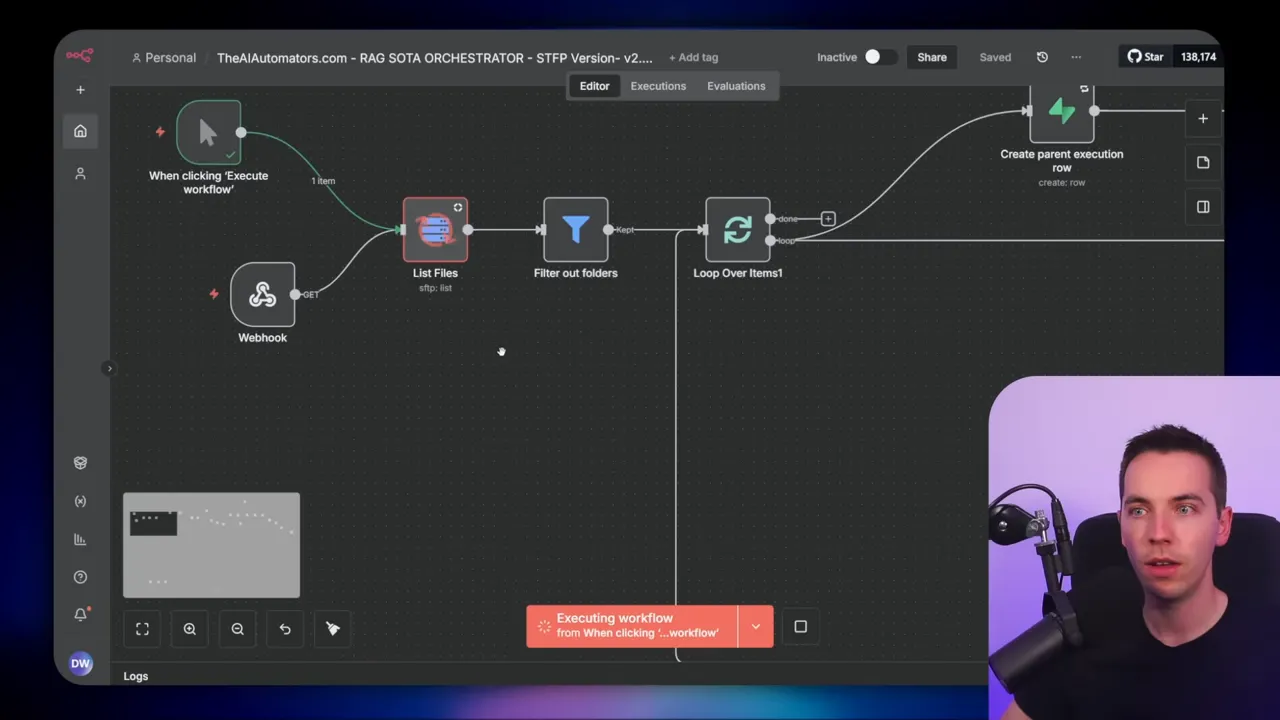
Here’s how the orchestrator behaves when you press Execute:
- It reads the entire file listing from a folder (I used SFTP for reliability at scale).
- It chunks that list into batches (I used 50 per batch for testing).
- For each file in the batch it creates a parent execution row in Supabase and then triggers the ingestion workflow via webhook for that file.
- Each webhook call starts the RAG ingestion workflow for one file and returns an execution ID. That ID is stored as a child execution under the parent record.
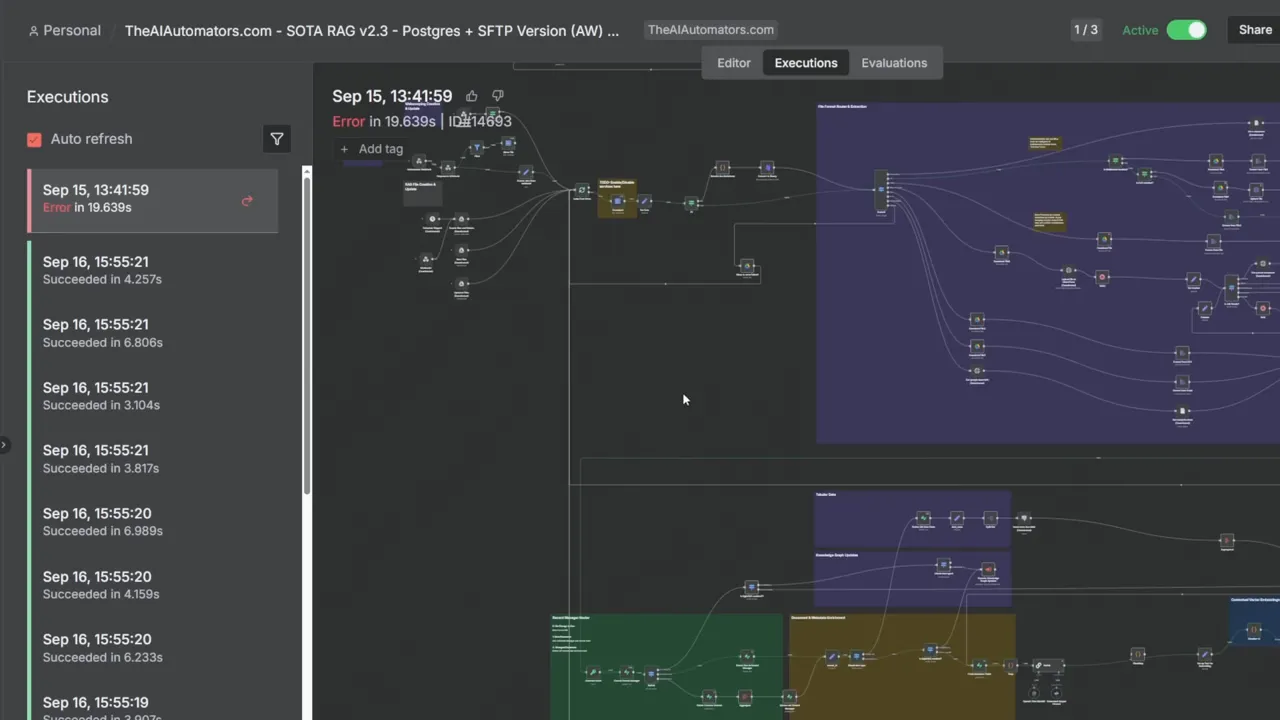
- The orchestrator then polls the child execution rows to see whether each file is success, pending, or error.
- If errors occur, the error handler updates the row to “error” and the orchestrator will automatically retry based on configured thresholds.
- When all child executions in the batch are successful, the orchestrator moves to the next batch.
This scheme keeps processing local to each ingestion execution. If one file fails, the whole batch doesn’t stop. That separation is what makes the imports fast and resilient.
Why SFTP?
For large imports, I avoided cloud drive APIs like Google Drive because they can serve stale listings or throttle when you poll frequently. I moved files to an SFTP server hosted on an affordable provider, then pulled the file list from there. SFTP gives stable, current listings and predictable performance.
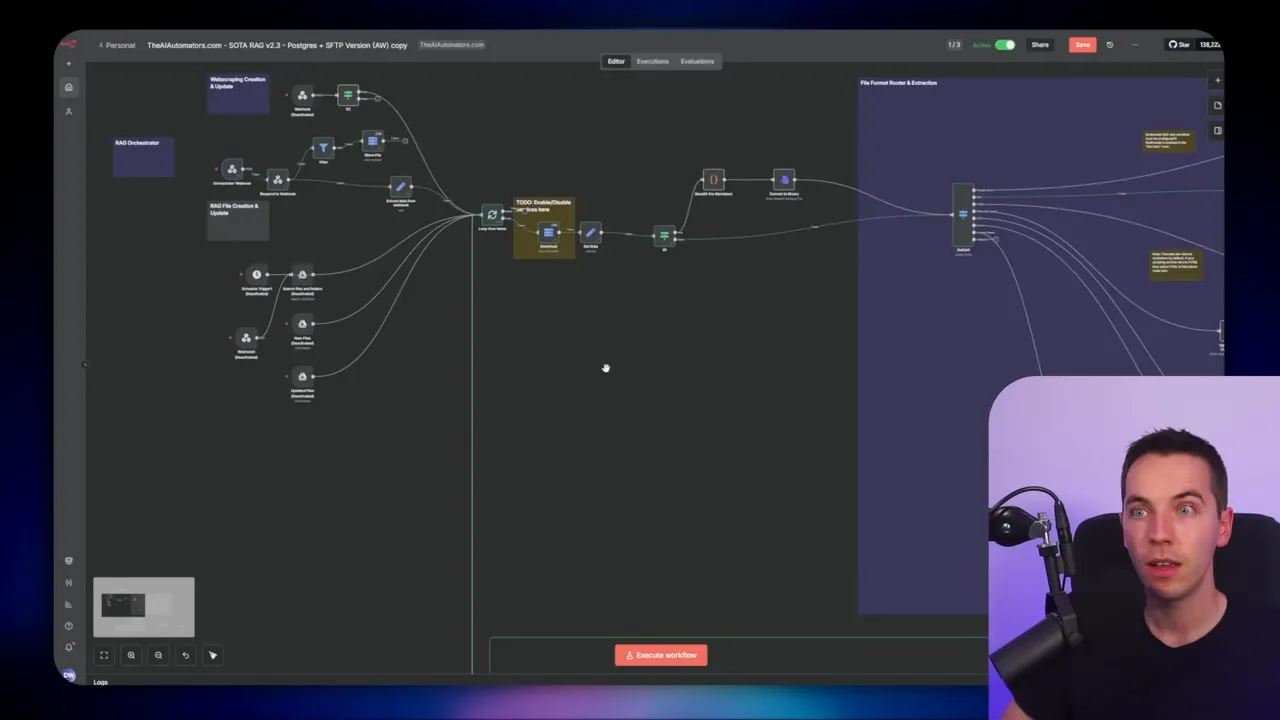
Building the orchestrator
I’ll go through the orchestrator step by step so you can recreate the logic in your own instance. I kept the workflow conceptually simple but covered the tricky details that make it work at scale.
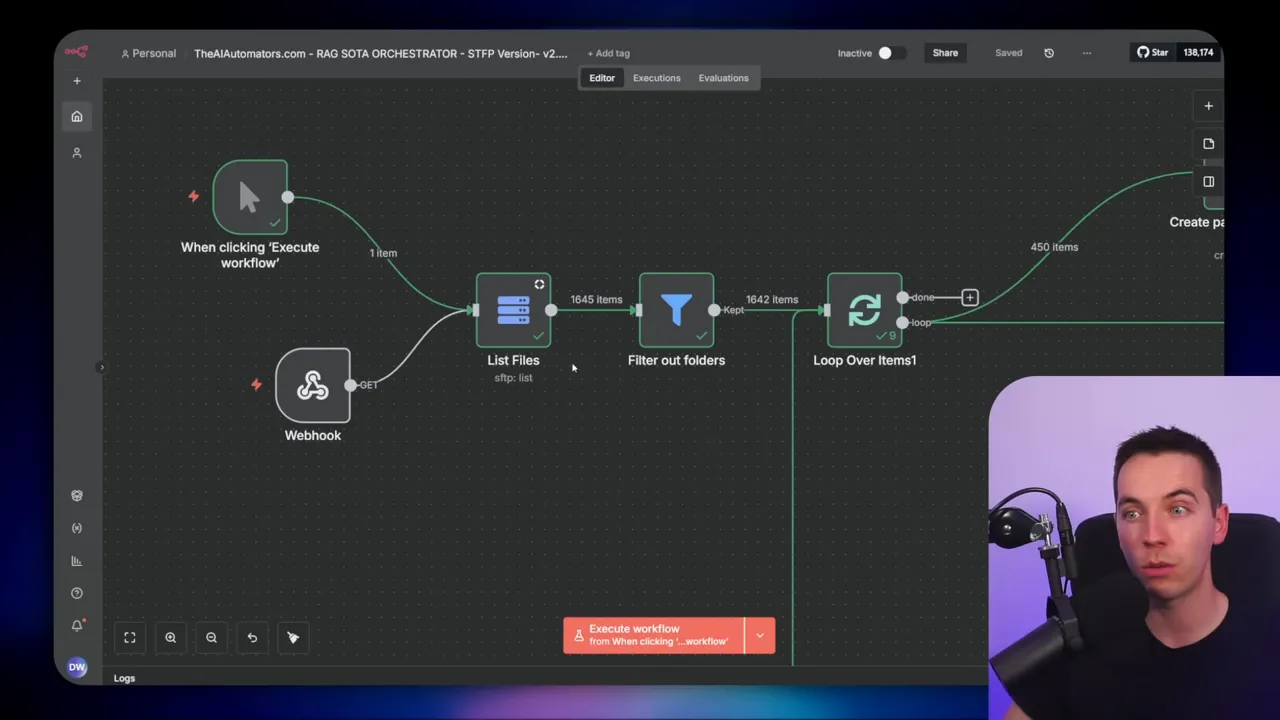
1. Get file listing
The workflow starts with a node that lists all files in a folder. If you’re using SFTP, configure your connection and point to the folder path. The node returns an array of file objects. Filter out folders in this step. SFTP returns directories as type D. If you don’t filter them, your logic will treat directories as files and you’ll run into errors.
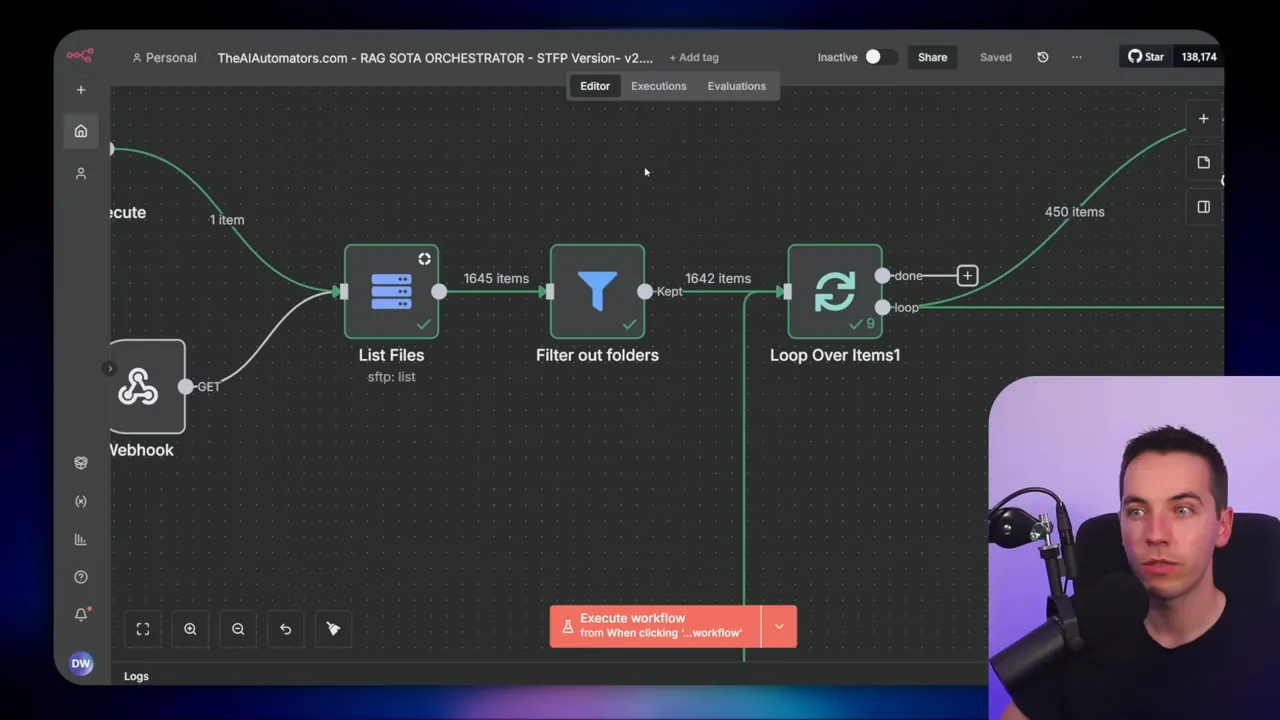
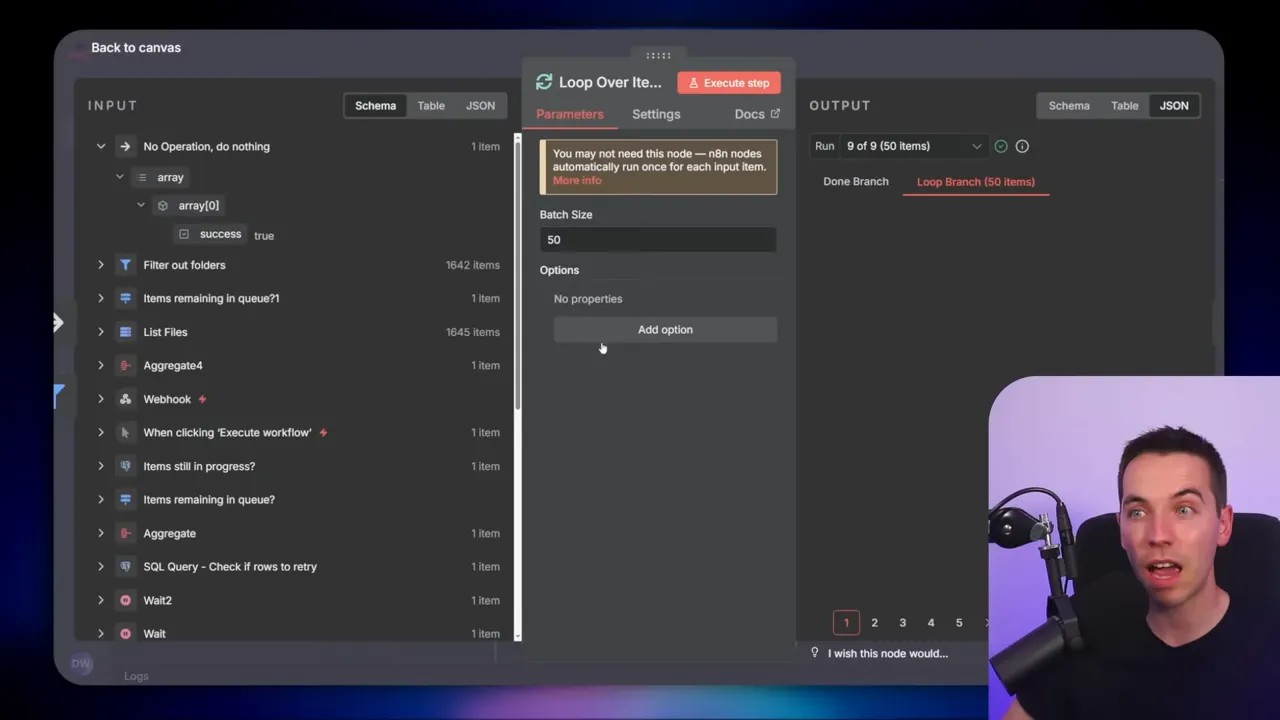
2. Split into batches
I use a Loop Over Items node with a batch size of 50. This node slices the full file array into groups of 50 and allows the workflow to handle each batch independently. That makes recovery straightforward: you only reprocess failed items within a batch rather than re-running thousands of files again.
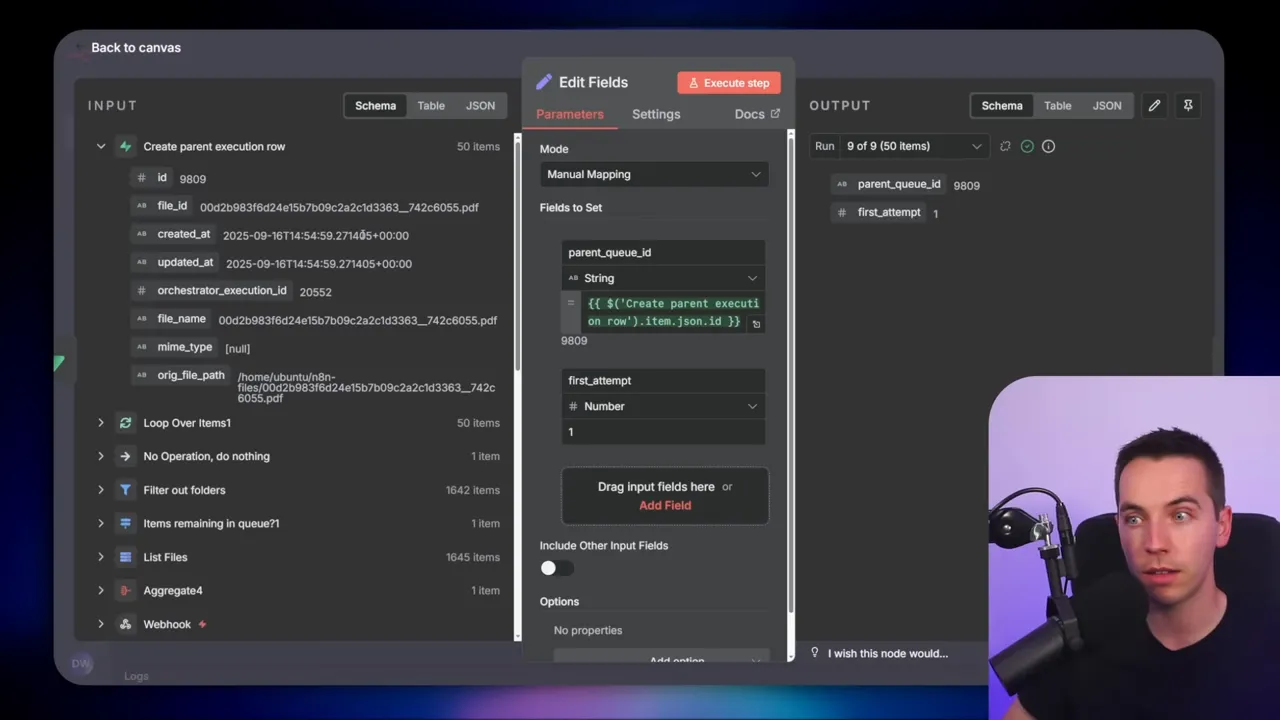
3. Create parent execution rows
For each file in the batch, I create a parent execution row in Supabase. The parent row includes:
- an orchestrator execution ID (unique per orchestrator run)
- the file name
- the original file path
- a timestamp
When Supabase creates the parent row, it returns the new parent QID. I merge that QID back into the file data so each file knows its parent record. I also set a flag called first_attempt which we use later to decide whether to move the file into a processing folder.
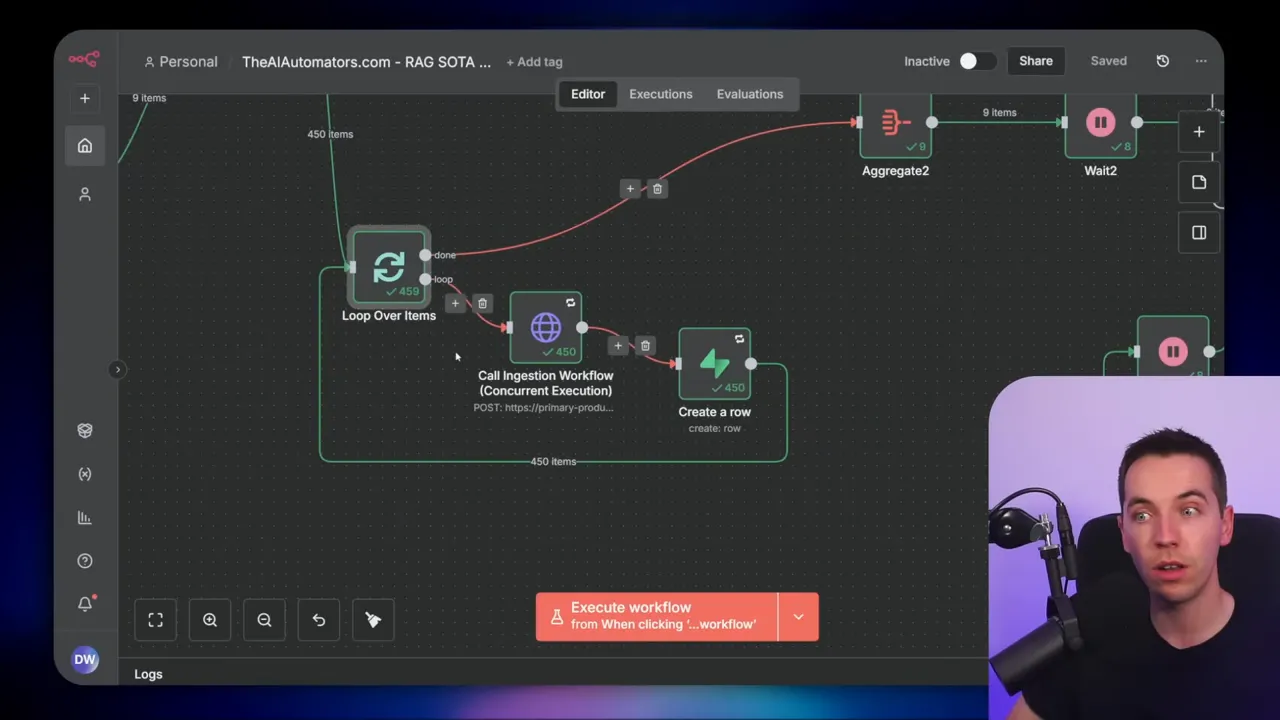
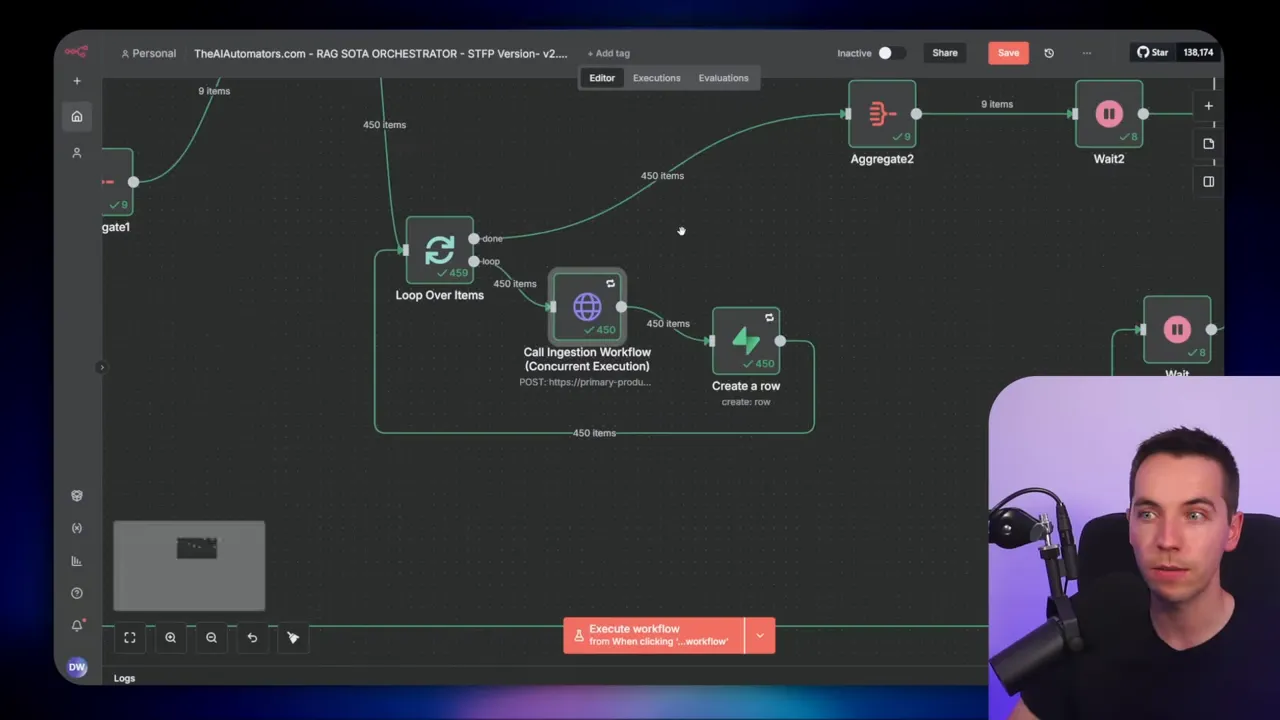
4. Aggregate and split for inner loop
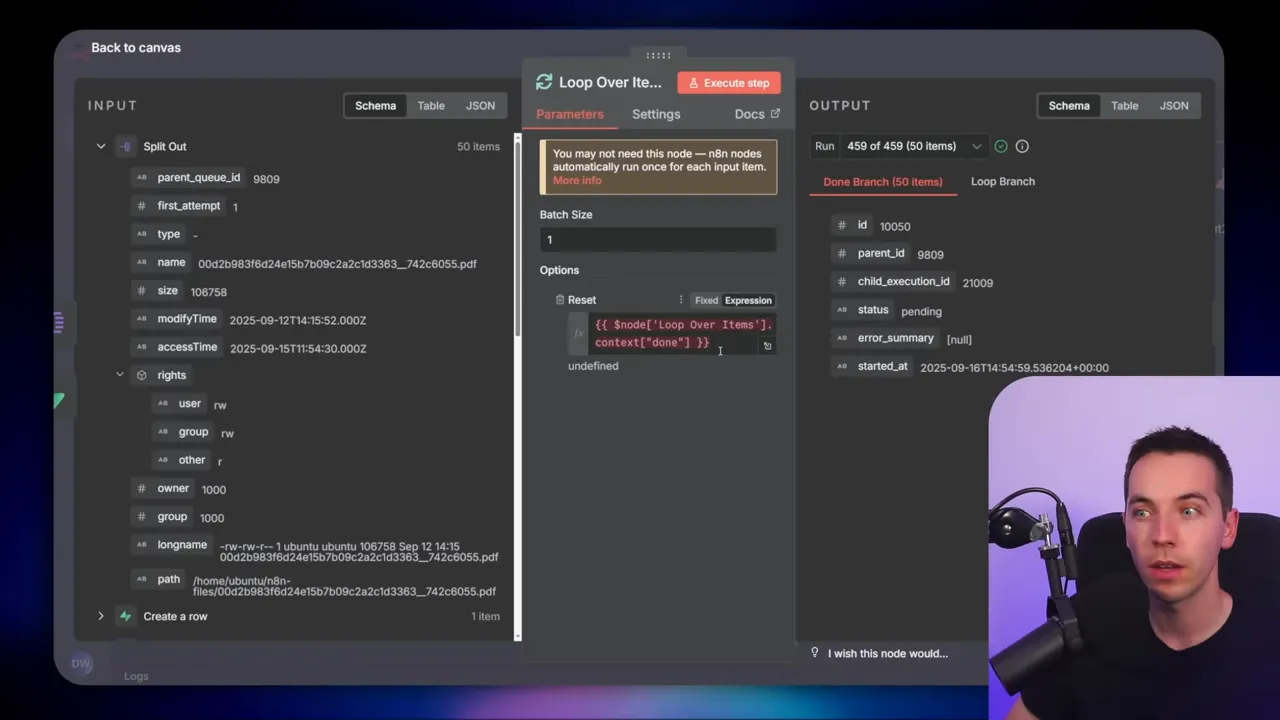
The orchestrator uses an aggregate node to turn 50 inputs into one item, then a split-out node to expand that one item back into 50 items for the inner loop. It sounds odd, but this pattern solves a detail around nested loops. If you nest Loop Over Items nodes, you must reset the internal counter for the outer loop, or the inner one will skip entries. The aggregate-and-split trick gives you a clean boundary between the batch and the per-file iteration.
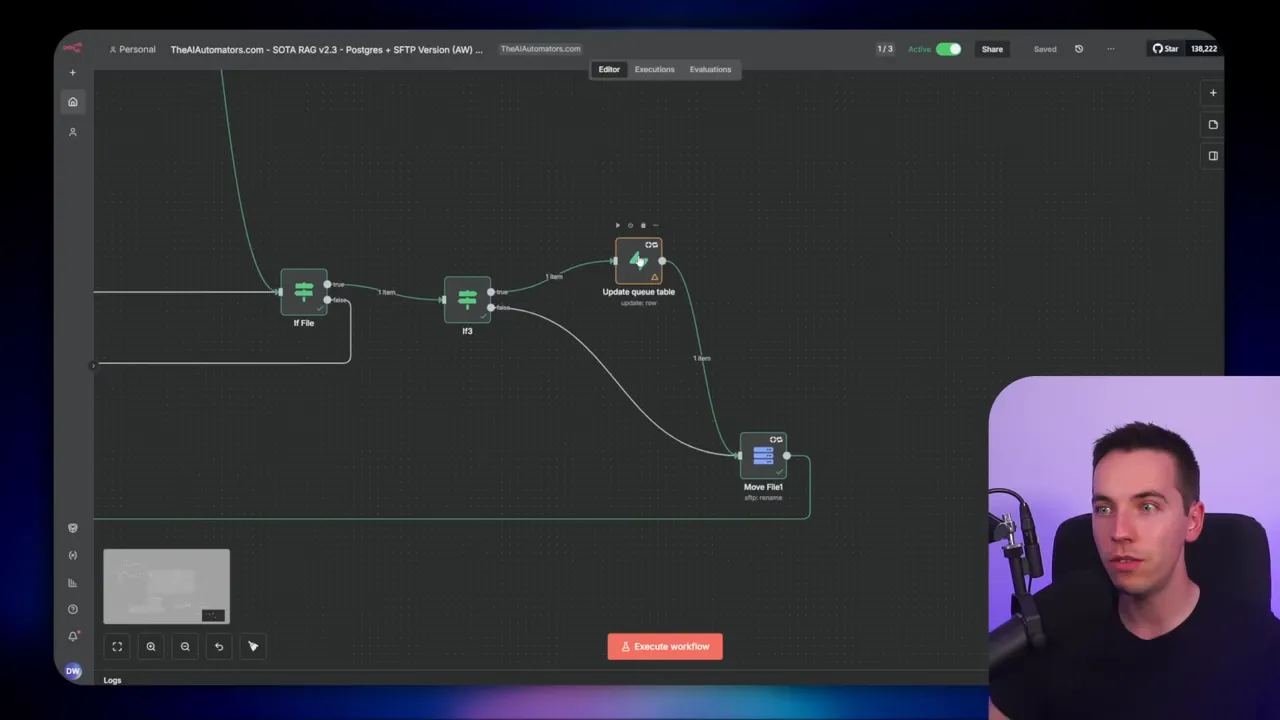
5. Inner loop: one file, one execution
The inner loop iterates with a batch size of one. For each file it:
- resets any loop counters via a context done node to avoid nested loop issues,
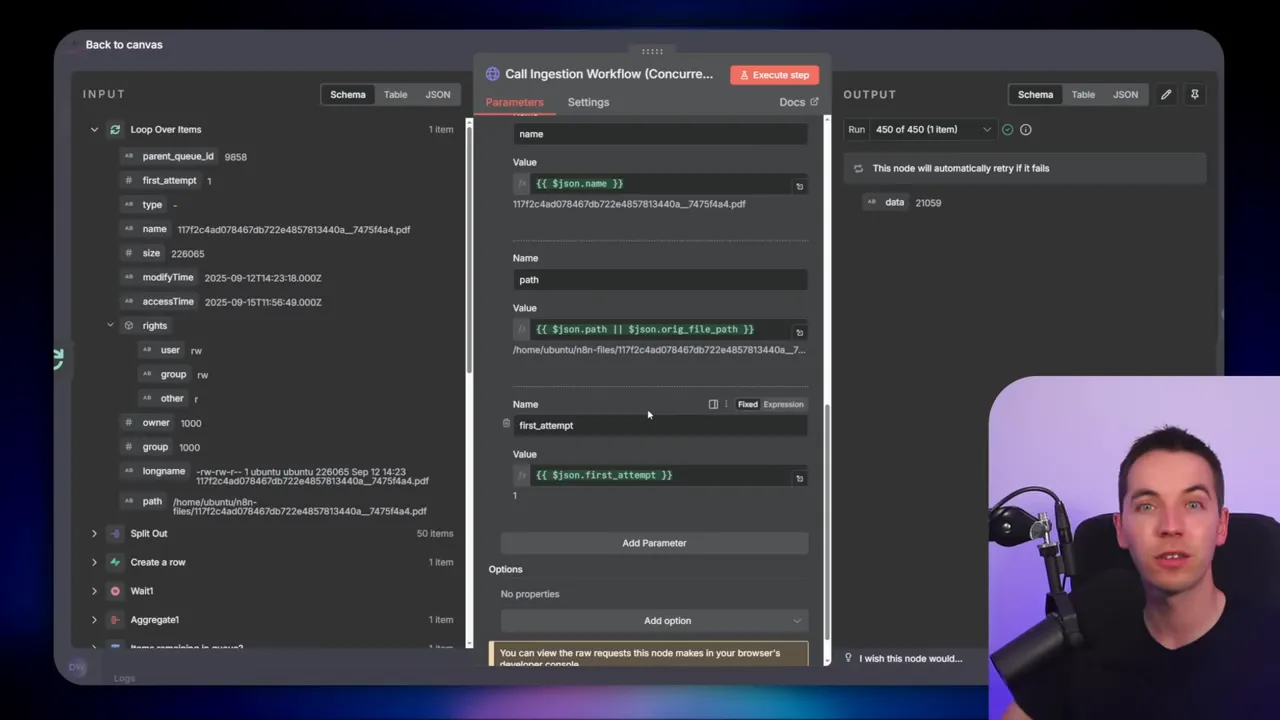
- calls the RAG ingestion workflow via webhook, passing file metadata (ID, name, path, first_attempt),
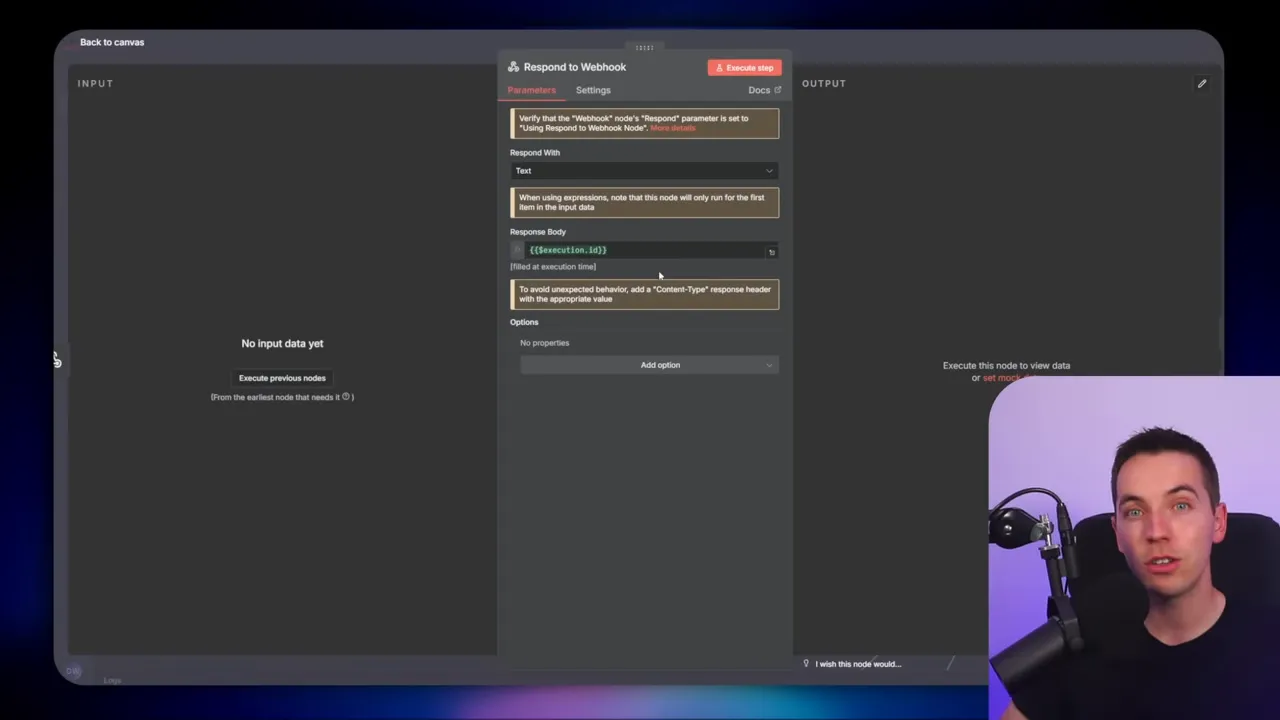
- receives the execution ID from the ingestion workflow’s Respond to Webhook node,
- inserts a child execution row into Supabase linking the child execution ID to the parent, with initial status “pending”.
This one-file-per-execution model avoids large binary payloads in any single run. It also gives me granular observability. If a file fails, I can see the exact execution ID, error details, and time. That data feeds into the automated retry logic.
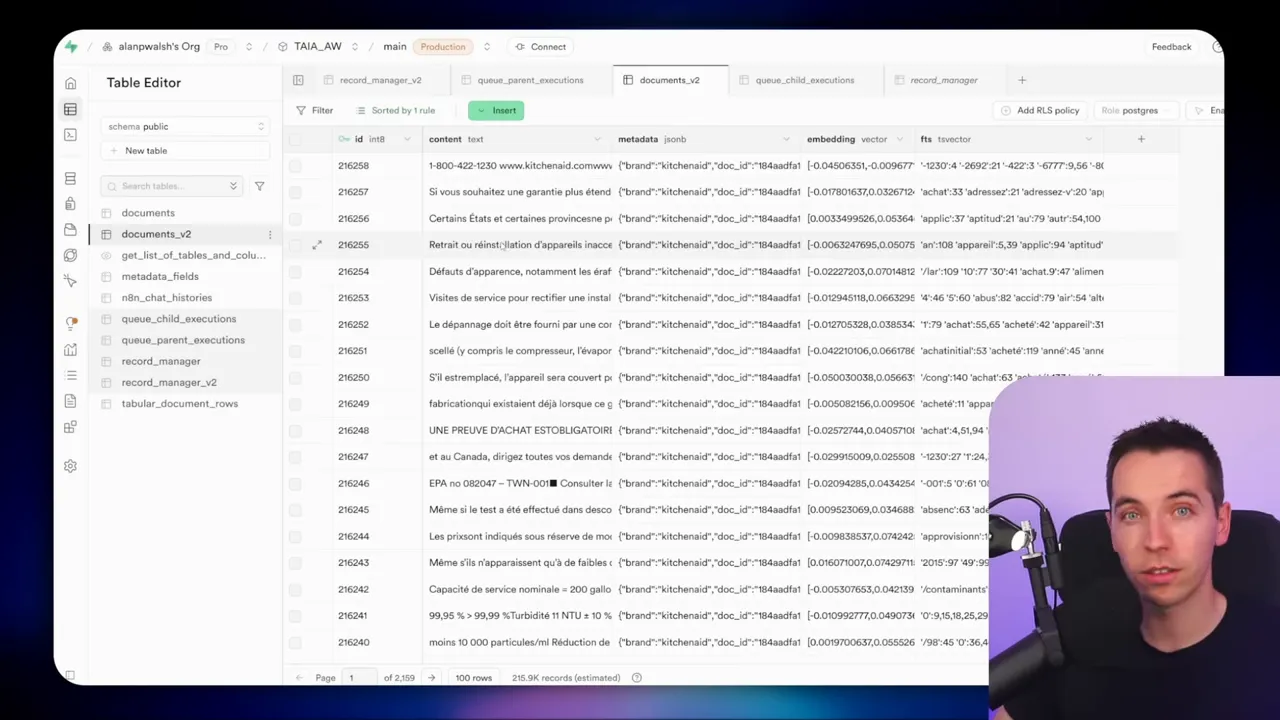
Parent and child execution model
I track progress with two tables in Supabase: queue_parent_executions and queue_child_executions.
Parent rows represent the orchestrator-run-level view. They store the orchestrator execution ID and file-level metadata. There will be one parent row per file per orchestrator run.
Child rows represent each attempt to ingest the file. A file might need multiple child attempts if it errors and is retried. A child row stores:
- child execution ID (the n8n execution ID returned by Respond to Webhook)
- parent ID (foreign key to the parent table)
- status (pending, success, error)
- error summary (filled if the execution errors)
- attempt count and timestamps
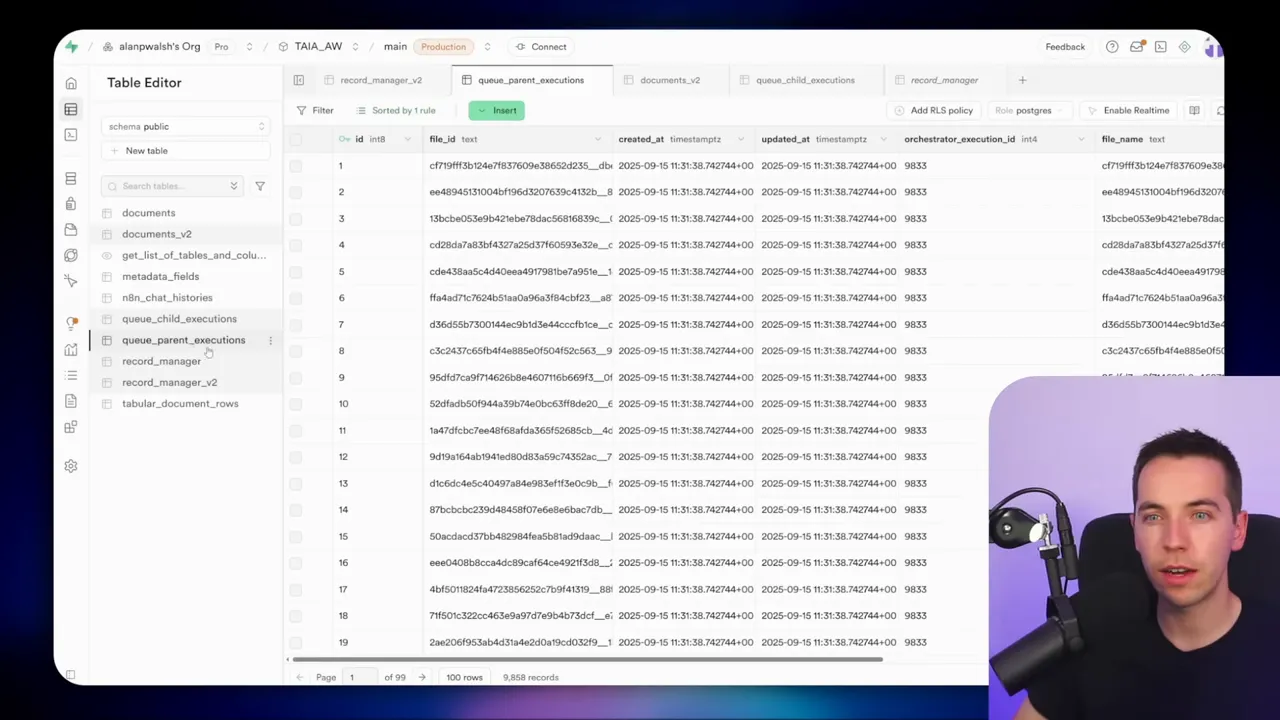
I enforce a foreign key constraint on the child table so you can’t create a child row unless the parent exists. That keeps data integrity and prevents orphan records.
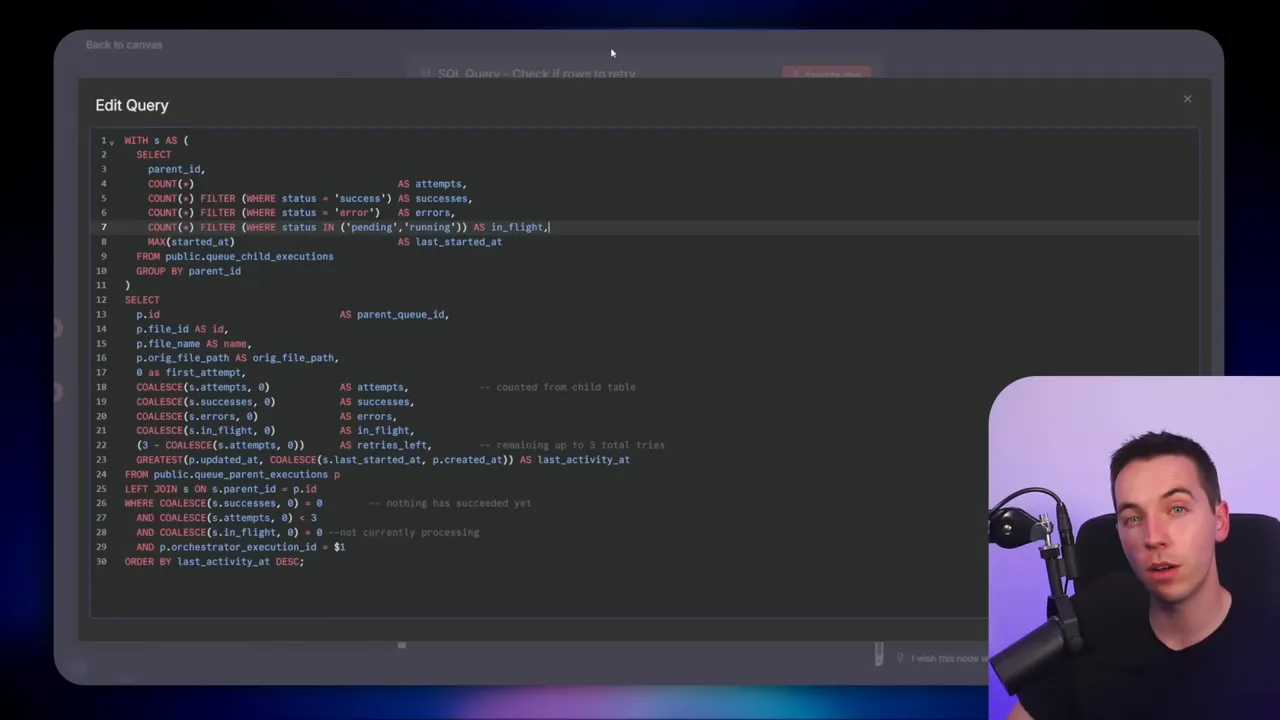
Polling and retry logic
Once a batch is invoked, the orchestrator enters a loop that polls Supabase for the current child execution states. Here’s how the SQL logic works conceptually:
- Aggregate child executions by parent to determine counts of pending, success, and error attempts.
- If a parent shows zero successful children and zero pending children, and the number of attempts is below the retry threshold, return that row for retry.
- If any child is pending, then pause for a short wait period and poll again.
- If errors are found and exceed allowed attempts, mark them as terminal (or route for manual handling).
The orchestrator then takes any returned rows and reprovisions them into the inner loop for another attempt. The aggregate-and-split nodes are critical here to convert between arrays and single items so the loop logic can reprocess a specific set of files.
Why webhooks instead of Execute Workflow
I tried both methods. Execute Workflow nodes look convenient at first. They let you call sub-workflows directly. But at scale I saw huge performance differences.
When I used Execute Workflow (sub-executions) the main n8n instance became unresponsive. It looked like all processing flowed through the core node. That core node then hit memory limits and slowed everything down.
When I switched to webhooks, n8n delegated incoming calls to worker nodes in queue mode. Webhooks appear to be treated differently by the n8n runtime: they let the main node handle routing, while workers run the actual executions. That resulted in far better concurrency and stability. Webhooks also return an execution ID immediately through a Respond to Webhook node. I needed that ID to populate the child execution table. Execute Workflow, by contrast, doesn’t provide a comparable response that includes the execution ID.
The trade-off is that cloud-hosted n8n plans may count each webhook call as an execution against billing quotas. If you self-host with a standard license, this isn’t an issue because you have unlimited executions.
Adapting the ingestion workflow
My original ingestion workflow listened to Google Drive triggers. I adapted it to accept file metadata via a webhook so it could be called by the orchestrator. The core steps inside the ingestion workflow stayed the same:
- Download the file (SFTP node gets the binary)
- Check whether the file changed compared to the existing record manager
- If changed, chunk the content and create embeddings
- Upload vectors to the vector store (Supabase or your chosen vector DB)
- Update metadata and record manager
- Report success to the orchestrator by updating the child execution row in Supabase
I added a Respond to Webhook node at the start to send back the execution ID. That ID is essential for linking the child record in Supabase to the running execution. After the ingestion completes, I update the Supabase child row to success. If something fails, the error handler (set as a separate workflow) will update the Supabase child row to error with an error summary.
Error handling: two layers
I use multiple layers of error handling:
- Local node retries: Every external API node has Retry On Fail enabled. This automatically retries transient API errors a few times before bubbling up.
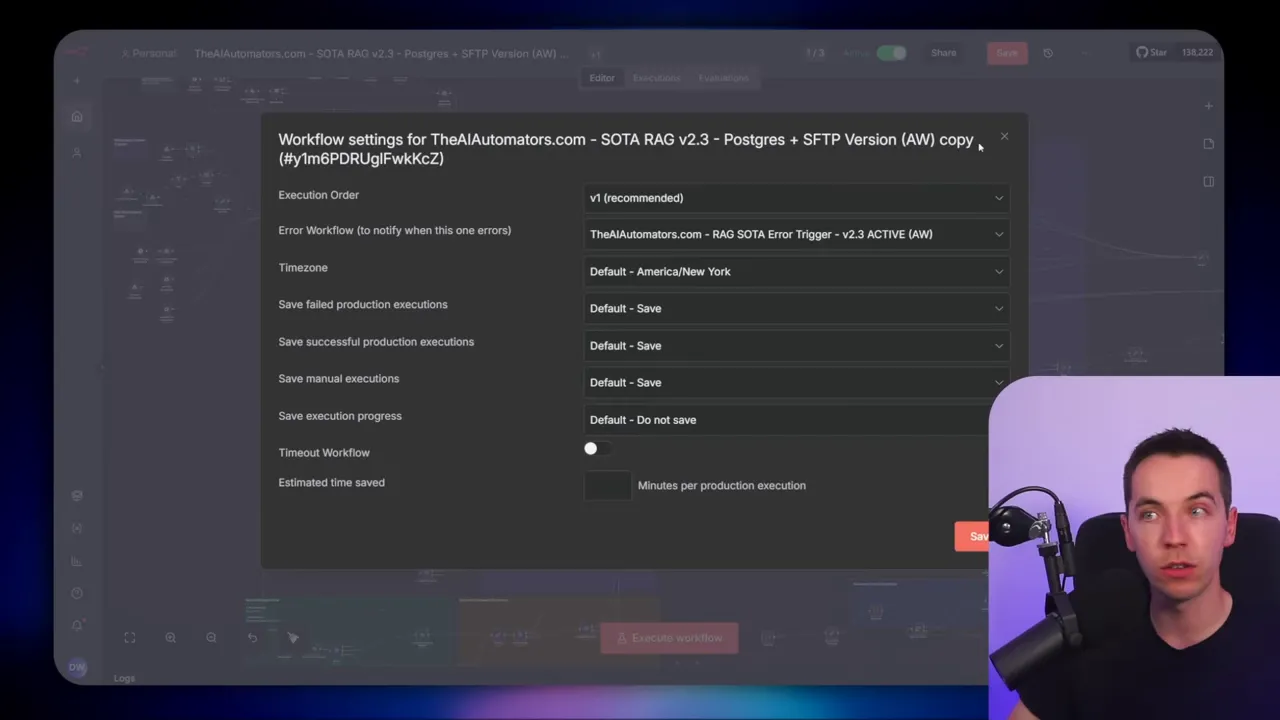
- Global error workflow: I wired the ingestion workflow settings to point to a separate error handler workflow. That workflow triggers whenever any execution errors and writes the error summary into Supabase for the corresponding child execution row.
This combination gives a robust first and second line of defense. The node-level retries often prevent failures from ever reaching the global handler. When failures do reach the error workflow, the orchestrator can detect them via the aggregated SQL and schedule retries if the attempts are under the maximum threshold.
One caveat: this entire approach relies on the ingestion workflow being idempotent or being able to handle repeated inputs gracefully. My workflow checks whether a document already exists and whether its content changed. If nothing changed, it skips. If it changed, it replaces the previous vectors. That avoids duplicate vectors in the database even if the orchestrator re-sends the same file multiple times.
How the error handler writes the failure
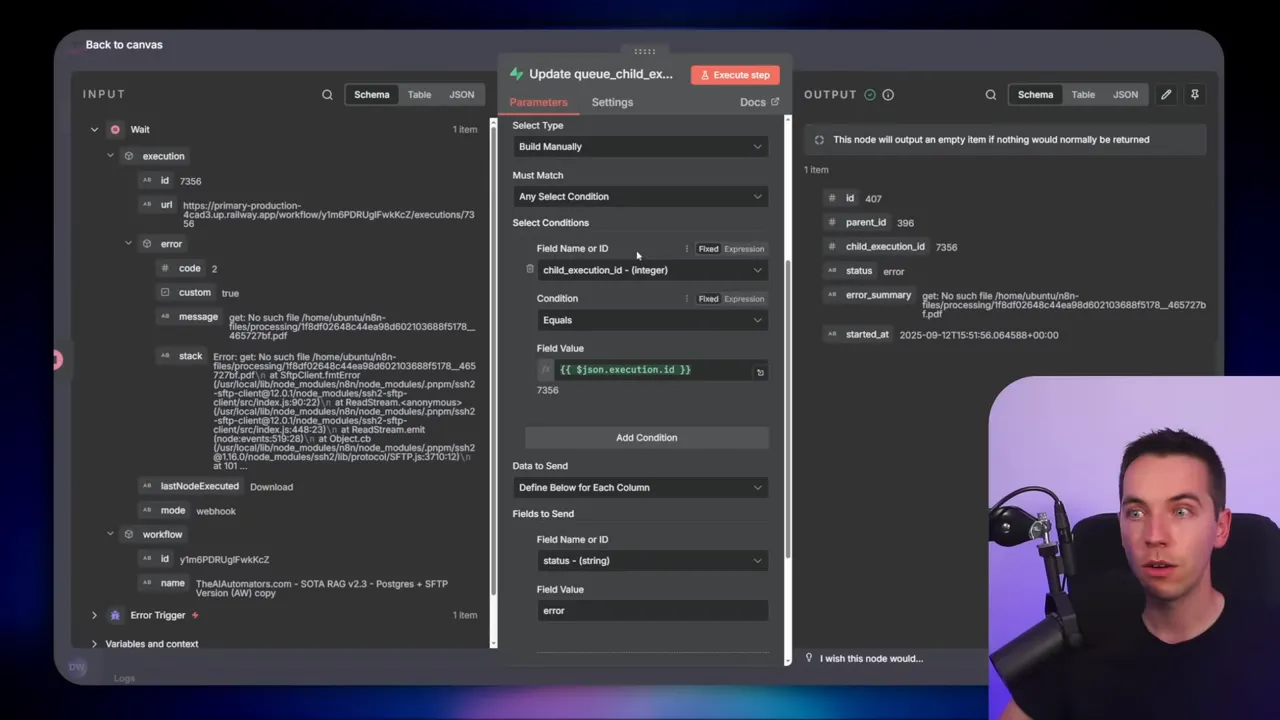
When an execution fails, n8n passes the failing execution ID to the error handler. I added a short wait at the start of the error workflow to allow Supabase rows to become consistent. Then the error handler updates the child row in Supabase where child_execution_id equals the failing execution ID. It stores the error summary (the JSON error message), sets status to “error,” and increments an attempt count. This data then informs the orchestrator’s retry SQL.
Key scaling lessons I learned
I want to highlight five lessons that will save you time if you’re planning a similar build. I explain each in plain terms and show why the change matters.
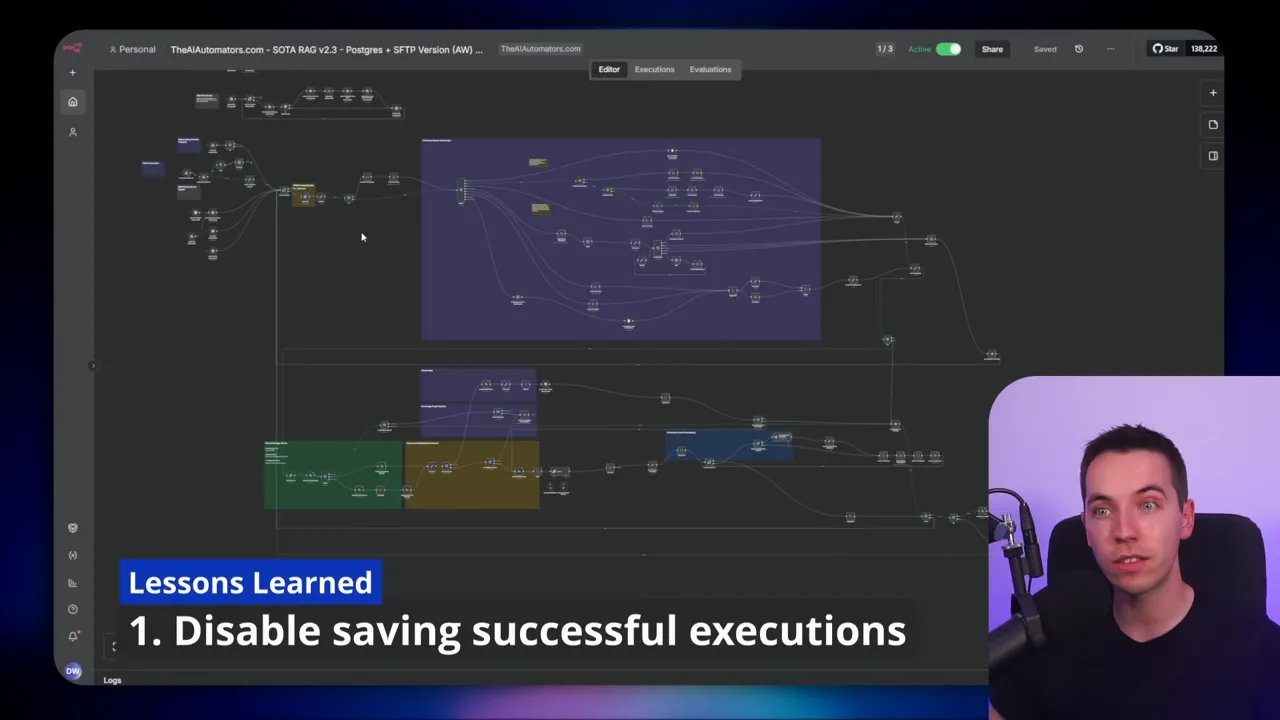
Lesson 1 — Turn off saving execution data when you’re at scale
By default, n8n saves execution data for every run. That includes all inputs, intermediate values, and outputs. If you process thousands of files with binary data or large base64 strings, your Postgres database will bloat fast. That caused crashes for me more than once.
You can disable saving execution data for successful runs by setting the environment variable executions_data_save_on_success to “none”. Modify this in your n8n config or in the hosting platform’s environment variables. When set, only failed runs are persisted for debugging.
Important note: keep execution saving enabled while you’re building and debugging. You’ll need those logs to understand issues. Only turn this off once your orchestration is stable and you’re sure you won’t need the full history. We once had enough execution data in Postgres that we ran SQL scripts to truncate execution tables. That was slow and risky. Stopping recorded successes earlier avoids that headache.
Lesson 2 — Use multiple layers of error handling
Relying on a single retry mechanism is fragile. External APIs often have short, transient errors. Make the node-level Retry On Fail your first layer. Use a global error handler that updates a database row as your second layer. Then use orchestrator SQL to decide if and when to retry a whole execution.
This layered approach helped me handle rate limits and temporary outages gracefully. Most failures were resolved by a local retry. The global handler caught the rest so the orchestrator could retry on a schedule rather than failing the entire batch immediately.
Lesson 3 — Don’t overload executions with too much binary data
Passing lots of binary data into a single workflow will likely trigger out-of-memory errors. n8n’s runtime can struggle to free large memory allocations during heavy concurrency. The simplest way around this is to run one file per execution. Keep each run small. Use webhooks to distribute work to workers if you need more parallelism.
That means you should keep ingestion nodes lean: read the file, stream or chunk it, send embeddings to your provider, and update the DB. Avoid keeping huge blobs in memory after you finish processing them.
Lesson 4 — Watch your Supabase plan and compute settings
Supabase’s free plan gives you Nano compute and a small DB. As you ingest lots of vectors and metadata, you will hit storage and compute limits. Upgrade to the Pro plan to get a free Micro instance. That often buys you enough runway to keep going.
If you see emails warning about exhausted resources, increase compute temporarily and scale it back after the heavy import. We upgraded, processed more data, then scaled compute back to save cost. For peak imports, a temporary bump in compute makes a big difference.
Lesson 5 — The orchestrator is only part of the puzzle
Building the orchestrator is a major step. But once it can issue thousands of calls, you’ll face new bottlenecks. The end-to-end instance must have enough workers. You must enable Q mode and verify that the workflow is actually delegating to workers.
Tuning the workflow is also critical. In a follow-up video, my colleague Daniel detailed changes that cut processing time per file dramatically. He tracked every change in a spreadsheet and benchmarked the performance. You should do similar measurements. Without methodical testing, it’s hard to know which node or step is slowing you down.
Practical tips and gotchas
Here are extra tips that helped me avoid common traps.
Keep the first_attempt flag
When the orchestrator sends a file to the ingestion workflow for the first time, I move the file into a processing folder. That prevents another orchestrator run from picking the same file. Use the first_attempt flag to gate that move operation so retries don’t re-move files or interfere with the processing state.
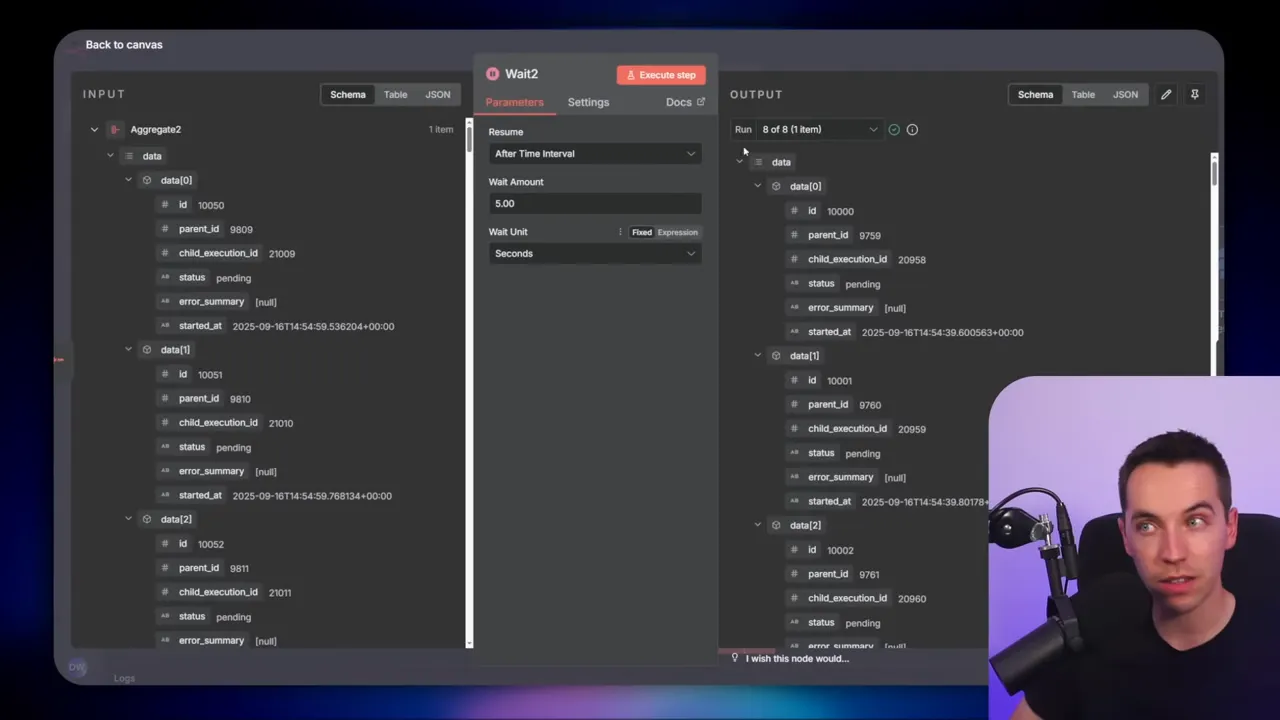
Use short wait nodes for polling
After issuing a batch, poll every 2–5 seconds depending on your throughput. Poll too frequently and you hit DB or API limits. Poll too slowly and you waste time. For my batches of 50, a 2-second poll made sense. I also added a 5-second wait in the error handler to ensure the Supabase row had time to be created and become visible when the error handler queries it.
Set a max polling counter
Always guard against infinite loops. Add a max polling counter to stop polling after a reasonable number of attempts. Then mark those items for manual review or escalate them to a different process. In my orchestrator I considered adding this guard as a future optimization.
Be careful with aggregate vs split nodes
aggregate takes many items and outputs one item. split does the opposite. When you refactor your flow, check the node types carefully. Aggregate-and-split combinations can confuse newcomers, but they solve the nested loop counter issue elegantly.
Plan for idempotence
Your ingestion flow must be able to handle duplicated calls. A simple presence-check plus a content-hash comparison avoids duplicate vectors. If the content didn’t change, skip the upload. If it changed, delete old vectors and insert new ones. That pattern prevents vector duplication and keeps your store clean.
Example troubleshooting scenarios
Scenario: n8n crashes with out-of-memory
Break large workflows into many small executions. Move binary processing to the ingestion workflow and call it one file at a time. Also make sure you disabled saving execution data for successful runs once the system was stable. That significantly reduced memory and DB pressure.
Scenario: Supabase returns resource exhausted
Upgrade to a Pro plan to get micro compute. If that still isn’t enough, temporarily escalate compute size for the ingestion window. Add monitoring so you can scale back after the peak.
Scenario: Too many rate limit errors from provider
Throttle parallel calls. Add small delays between groups of calls or introduce per-provider rate limiting in your orchestration logic. If your provider has a concurrency limit, ensure you don’t exceed it by tuning batch sizes and worker counts.
Scenario: Unknown error stops a batch
Make sure every node that calls an external service has Retry On Fail enabled. If the error still triggers the global handler, the orchestrator will see the child row marked “error” and will either retry automatically (if attempts remain) or flag for manual review.
Monitoring and measuring performance
To tune throughput you need metrics. Track:
- Files processed per minute/hour
- Average time per file (download → embeddings → upload)
- Failure rate per batch
- Retries per file
- API rate limit responses
I logged every run into a spreadsheet while iterating. That helped me find slow nodes, unnecessary metadata steps, and API calls with high latency. When you have hard numbers, you can change one variable at a time and measure impact.
How I got to 5,000 files per hour
There was no single change that unlocked that throughput. Rather, it was a sequence of improvements:
- Refactor the ingestion workflow to avoid unnecessary transformations and reduce per-file overhead.
- Switch to webhooks so n8n could use worker nodes for concurrency.
- Break the job into one-file executions and add parent/child tracking.
- Enable node-level Retry On Fail and add the global error handler tied to Supabase.
- Adjust Supabase compute temporarily and disable saving successful execution data once stable.
- Iterate and measure performance changes, then tune batch sizes and worker counts.
When combined, these changes allowed me to reliably process thousands of manuals and product documents and build a vector store with hundreds of thousands of chunks. The retrieval speed on that store remained fast — sub-second on hybrid searches — because ingestion and retrieval are decoupled and optimized independently.
Scaling further: next technical steps
If you want to push throughput beyond tens of thousands per hour, consider the following technical steps:
- Increase the number of worker nodes for n8n and ensure you run in queue mode.
- Benchmark and reduce per-file processing time (optimize chunk size, embedding model calls, parallel embedding requests if allowed by provider).
- Use batched embedding calls where supported to reduce API call overhead.
- Introduce rate limiting per provider in orchestrator logic to avoid throttling during bursts.
- Use a high-performance vector database with horizontal scaling if vector count grows into the millions.
- Introduce alerting and automated scaling based on queue depth or rejection rates.
One practical way to reduce per-file time is to pre-process documents to remove irrelevant content and to tune chunk sizes. For many manuals, removing repeated boilerplate sections and setting a chunk overlap that balances retrieval quality and embedding volume can shrink the number of vectors per document and lower cost.
Final operational checklist
Before you run large imports, walk through this checklist:
- Make sure your ingestion workflow is idempotent or has a safe update/update-delete flow.
- Test the orchestrator with a small batch and confirm Supabase rows track correctly.
- Enable Retry On Fail for external API nodes.
- Set a reasonable batch size. Start small and increase while monitoring.
- Decide when to disable saving successful execution data. Keep it on during testing.
- Configure Supabase compute and storage to match expected ingestion volume.
- Enable queue mode and verify workers are processing webhook executions.
- Set max polling counters and alert thresholds to avoid infinite loops and silent failures.
Following those steps will minimize surprises and make recovery straightforward when something does go wrong.
Closing thoughts on maintainability
Design with simplicity and observability. Tracking every file and every execution in a structured database gives you the ability to pause, audit, and retry without losing state. Small, focused runs are easier to debug than giant monolithic workflows that entangle many files’ binaries and many external calls.
Keep iterating. Measure changes, keep a changelog or spreadsheet, and roll back step-by-step if a change hurts throughput or reliability.
